Verada AI Chat
WARNING
Verada AI Chat is currently in Beta. Responses, charts, and written analysis should be reviewed before being shared or used for decision-making.
What Is Verada AI Chat?
Verada AI Chat is a conversational analysis tool inside Insights. It can help you explore data in plain language, generate charts, summarize trends, compare results, and ask follow-up questions without manually building every query first.
Depending on the request, Verada AI Chat can:
- Answer questions in natural language
- Generate one or more charts
- Analyze chart data and explain patterns
- Suggest follow-up questions
- Start from an existing chart or dashboard context
- Save conversations so they can be reopened later
When To Use It
Verada AI Chat is useful when you want to:
- Quickly explore a question without building a chart manually
- Ask for a summary of trends, changes, or anomalies
- Compare dimensions such as device, source, campaign, or region
- Turn a question into a chart you can refine further
- Start with an existing chart or dashboard and ask what it means
Opening Verada AI Chat
You can open Verada AI Chat in any of the following ways:
- Verada AI Chats list in the sidebar
- The sparkle (✦) button on the bottom right of the screen
- The sparkle (✦) button on charts
- The "Ask AI" button in the dashboard menu
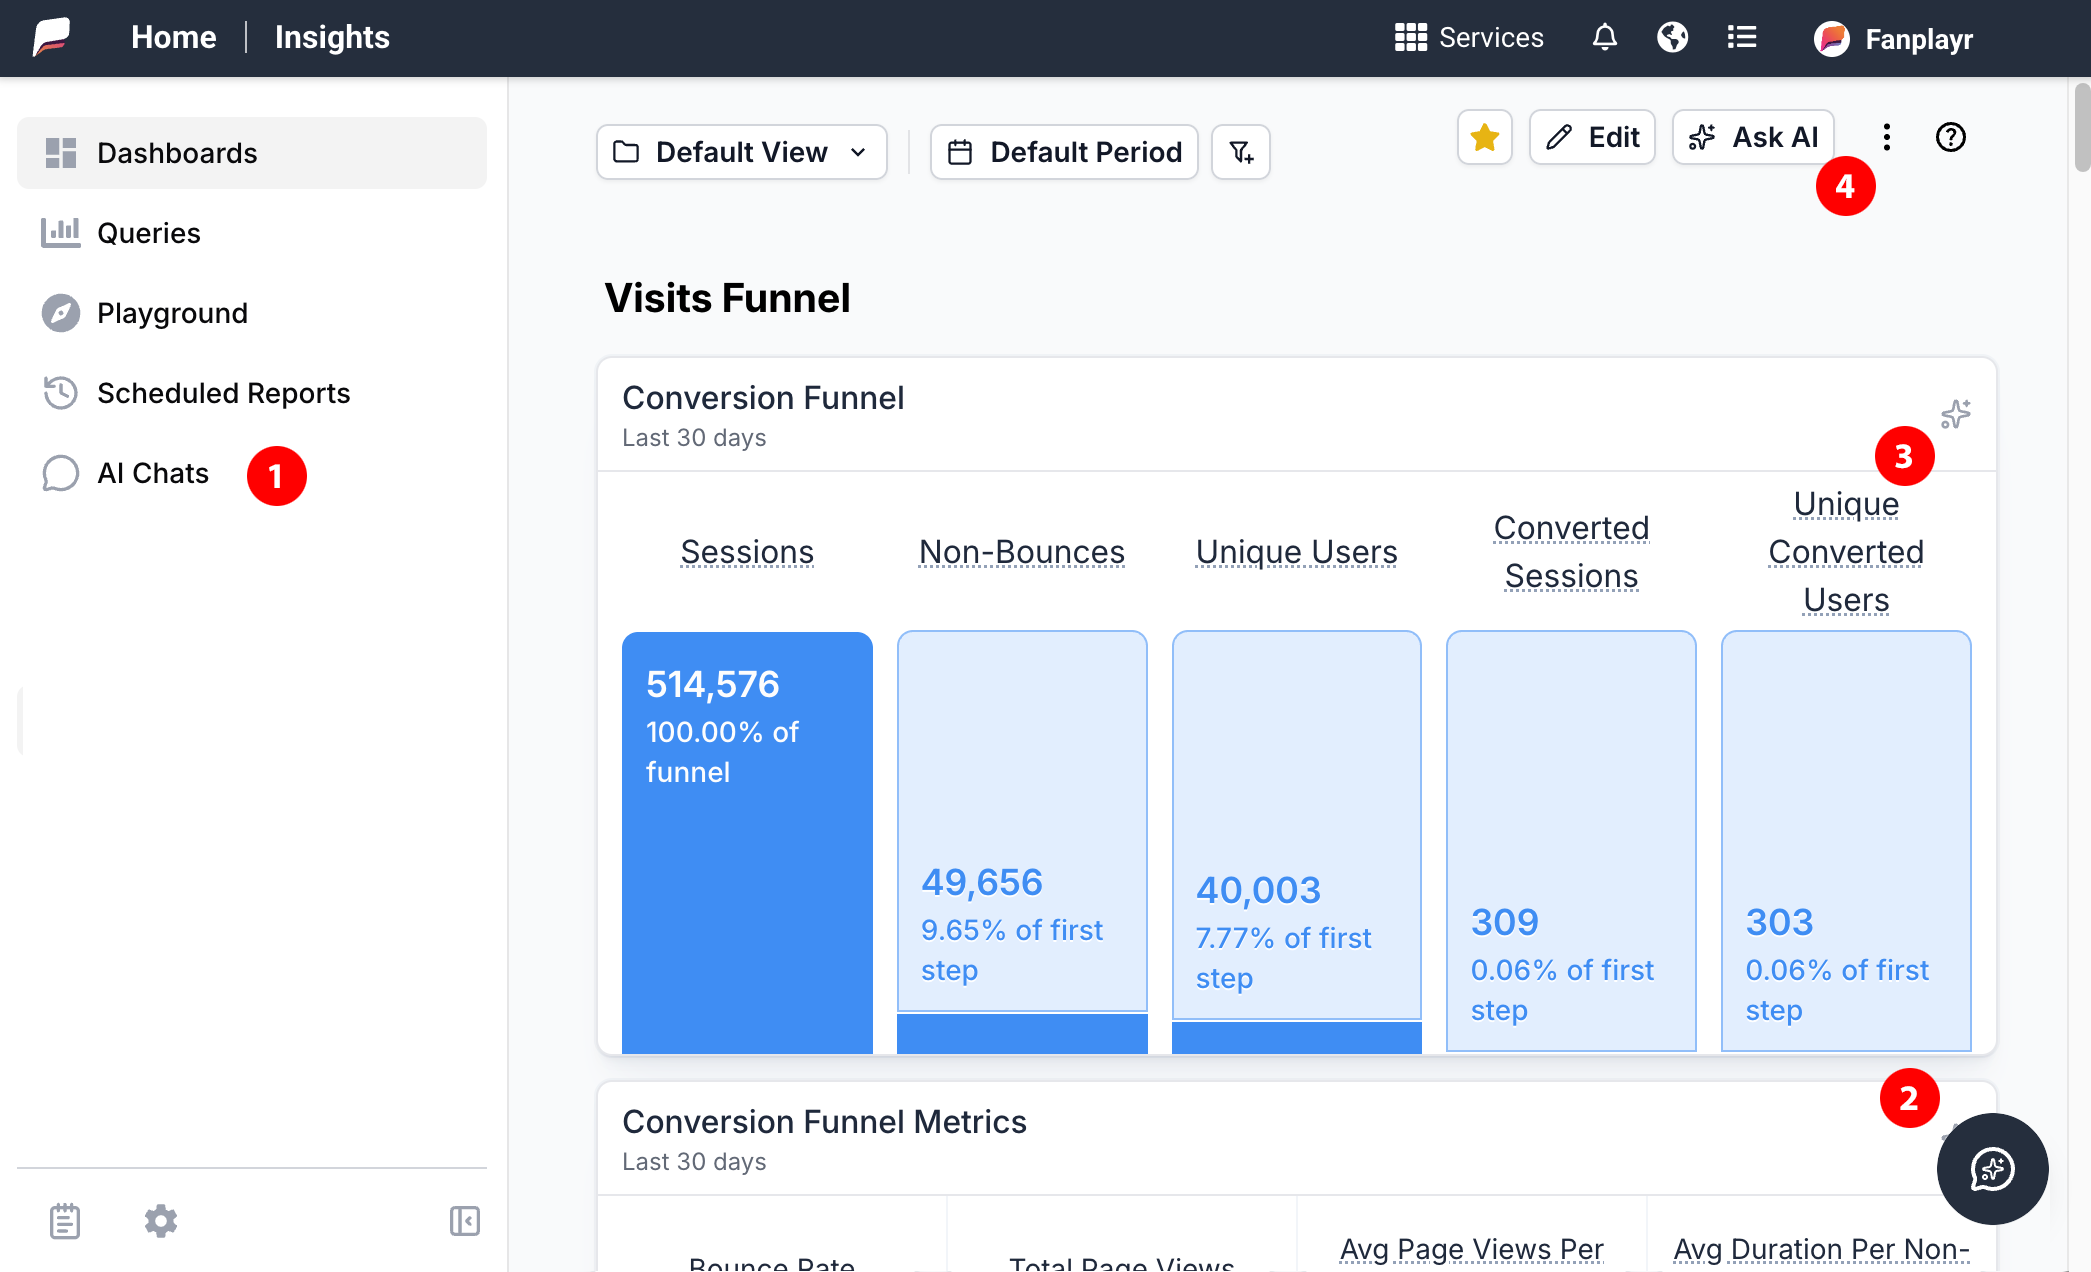 Where to start interacting with Chat
Basic Workflow
- Open Verada AI Chat.
- Type a question in plain language.
- Press
Enterto send. - Review the response, charts, and analysis.
- Click a suggested follow-up or ask your own next question.
- Save, rename, share, or continue refining the conversation.
Note
If you want to interact with the Chat in a specific language please change the language in the Portal before interacting.
Example Questions
- Show me sessions by traffic source
- Compare conversions by device type
- What changed week over week?
- Show sales trends over time
- Which campaigns drove the highest revenue?
Writing Better Prompts
The clearer the request, the better the result. Good prompts usually include:
- The metric you care about
- The dimension to break it down by
- A timeframe if it matters
- Whether you want a chart, summary, or comparison
Better Prompt Examples
- Show revenue by campaign for the last 30 days
- Compare conversion rate by device type this month
- Summarize the biggest traffic changes from last week
- Create a chart of sessions by landing page and explain the top movers
What You'll See In A Response
An Verada AI Chat response may include one or more of the following:
- A written answer
- One or more charts
- Analysis explaining what the data shows
- Suggested follow-up questions
- References connecting the written analysis to charts in the conversation
In some cases, Verada AI Chat may gather additional data before finishing the final analysis.
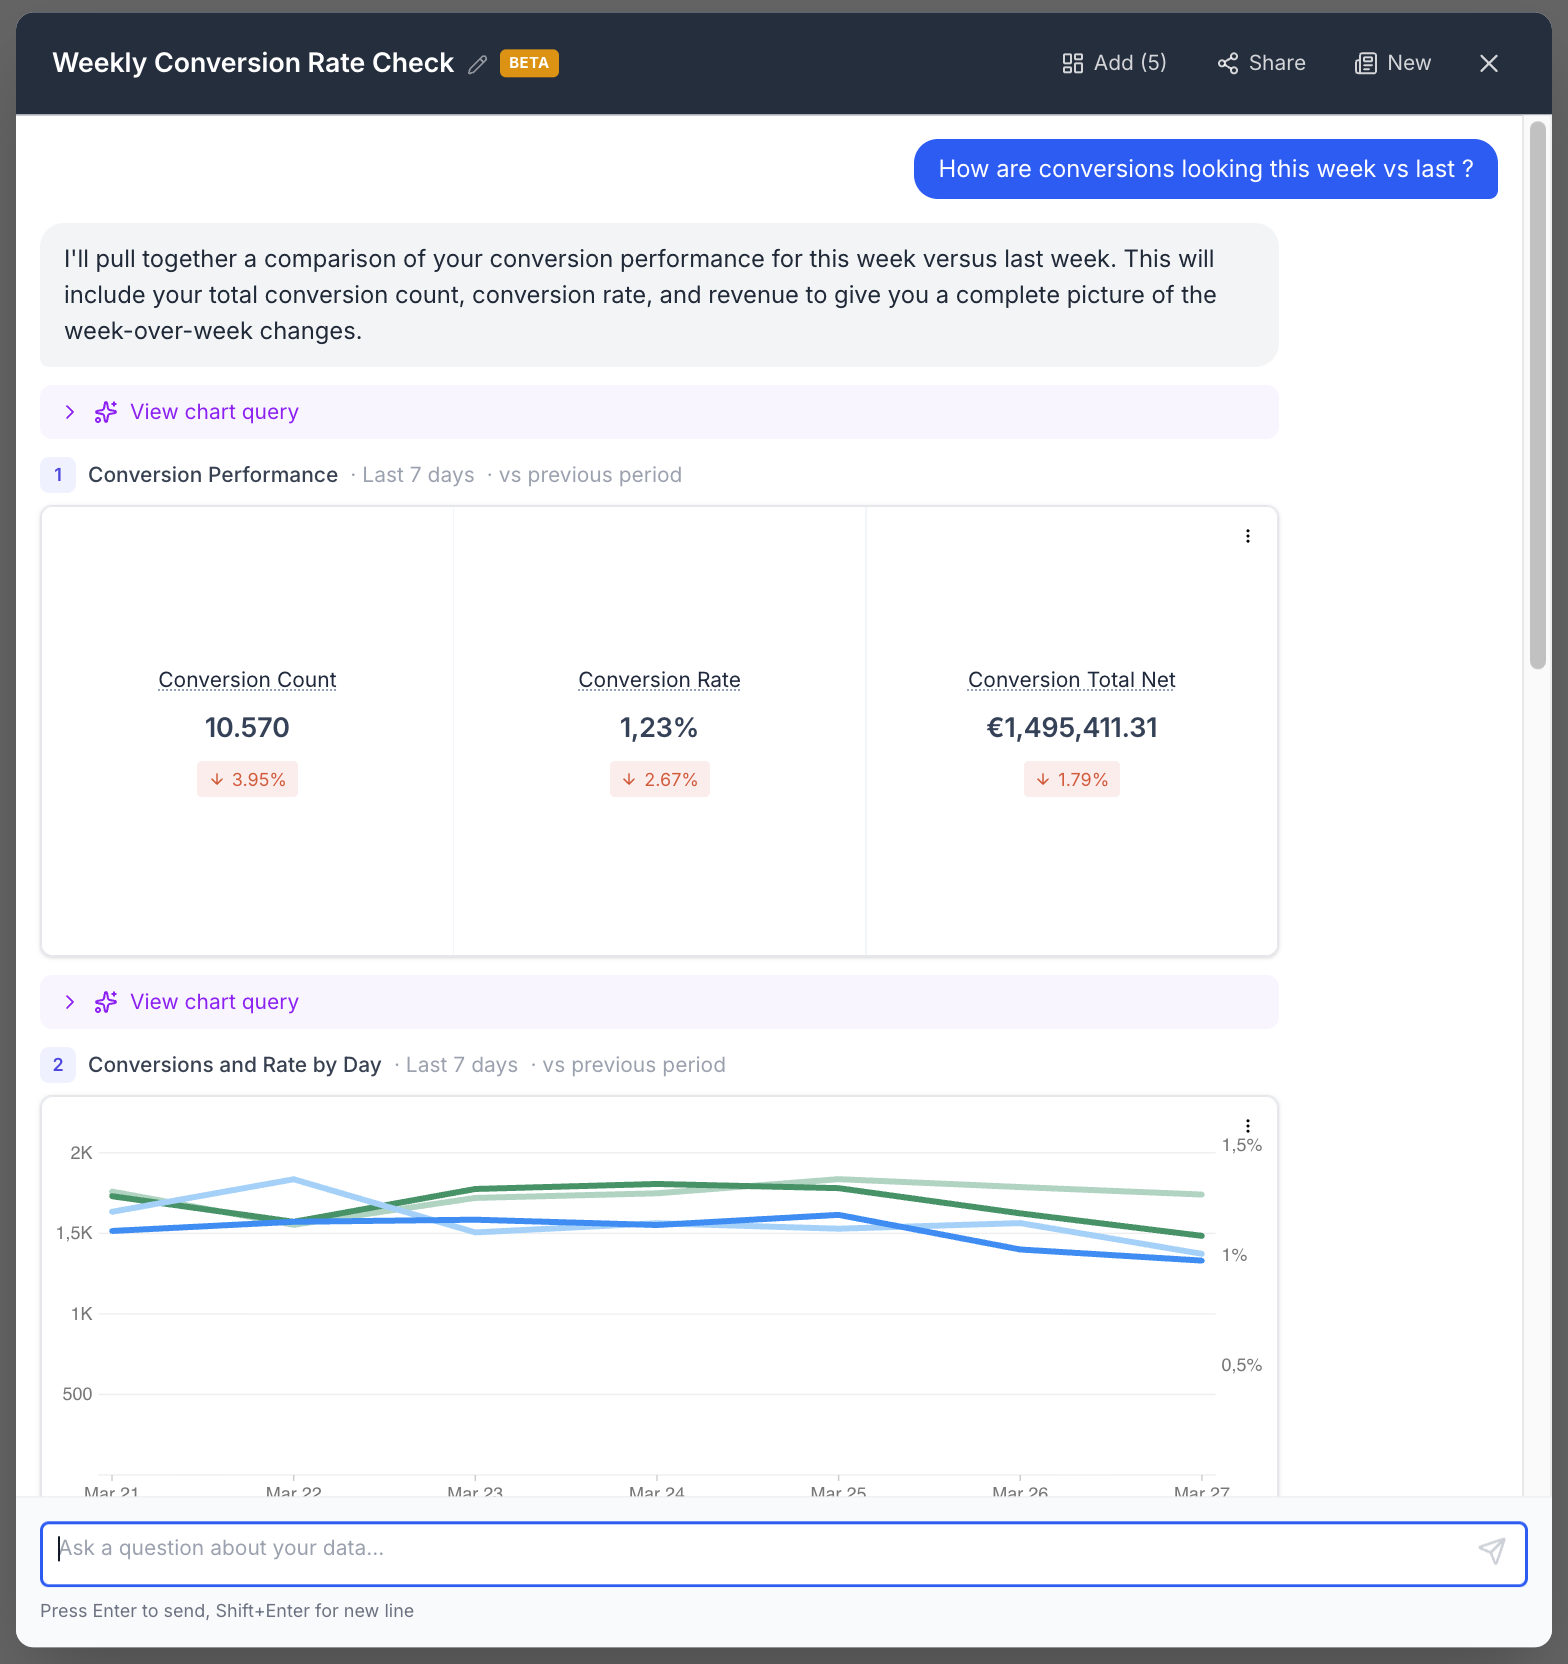 Example Chat #1
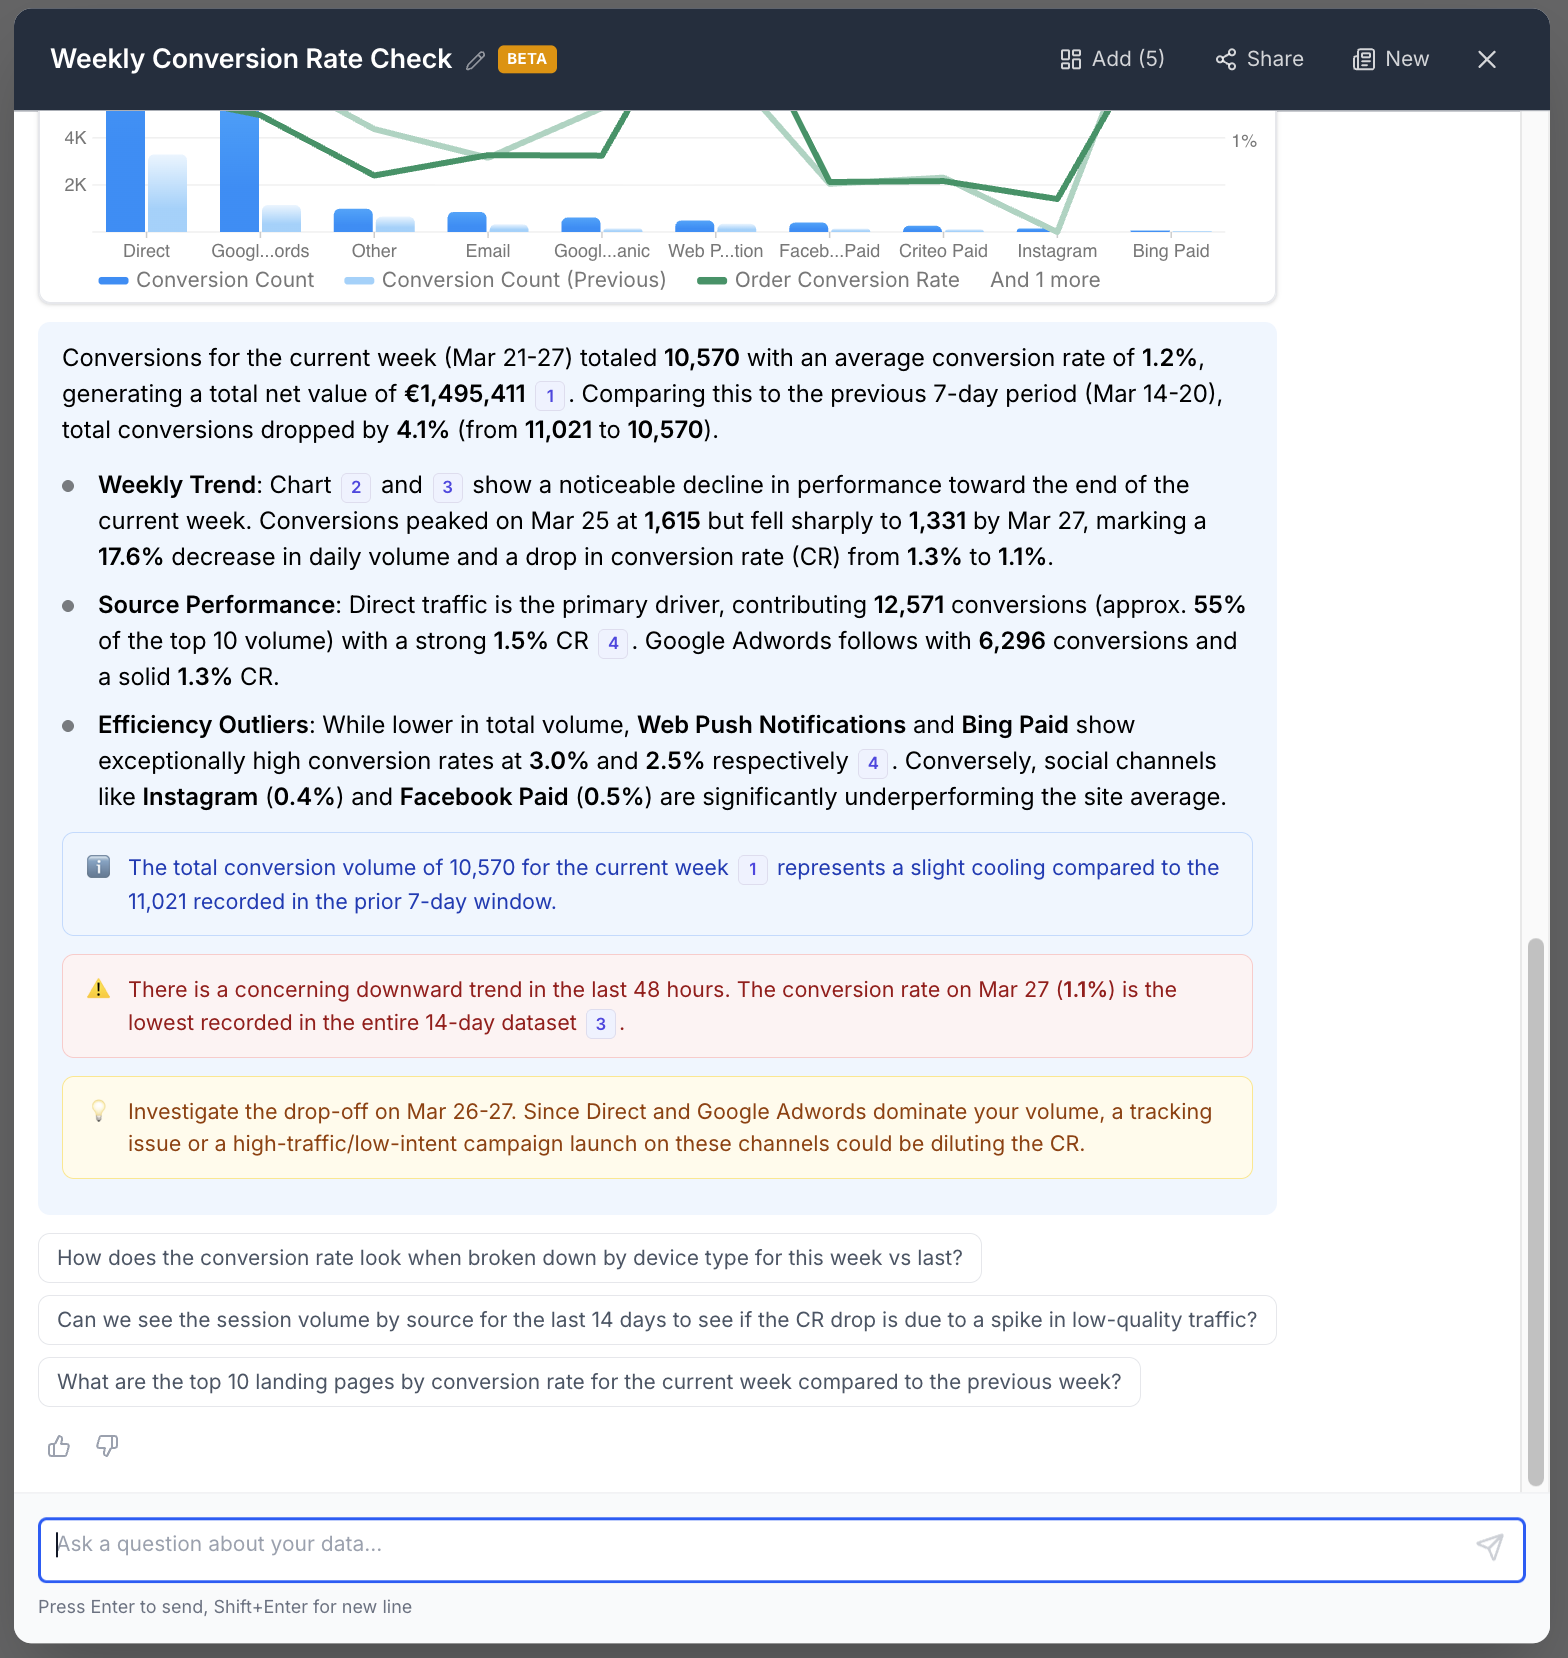 Example Chat #2
Working With Charts
When Verada AI Chat creates a chart, you can use it as a starting point for further work.
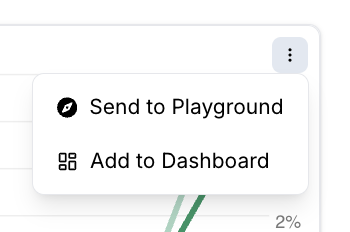 Clicking the chart menu for more options
Available actions for a single chart:
- Send to Playground
- Add to Dashboard
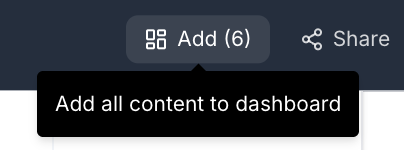
You can also click "Add" button in the header to add all Charts in the Chat to a Dashboard.
 alt text
::: hint Verada AI Chat is a strong starting point, not the final step for every workflow. If a chart is close but not perfect, open it in Playground and refine it there. :::
Continuing The Conversation
You can continue exploring by:
- Asking a follow-up question in the same chat
- Clicking one of the suggested follow-up prompts
- Referring to an earlier chart from the conversation
- Starting a new chat when you want to switch topics
Verada AI Chat keeps context from the current conversation, so follow-up questions usually work best when they clearly refer to the same topic.
Starting From Existing Content
Verada AI Chat can also begin with context that already exists in Insights.
Start From A Chart
When launched from a Chart, Verada AI Chat can:
- Show the Chart in the conversation
- Analyze the underlying data
- Suggest follow-up questions about that Chart
Start From A Dashboard
When launched from a Dashboard, Verada AI Chat can:
- Pull in the Dashboard's charts
- Analyze them together
- Help identify trends, outliers, or next questions to explore
Saved Chats
Chats are saved so you can return to them later.
From saved chats, users may be able to:
- Reopen an earlier conversation
- Rename a Chat
- Delete or archive a Chat
- Review the most recently active Chats
INFO
Chat titles may be generated automatically at first, but they can be renamed later.
Sharing
Saved Chats can be shared with anyone on your account.
If a user opens a shared Chat and continues the conversation, we will create a copy so the original shared version stays unchanged.
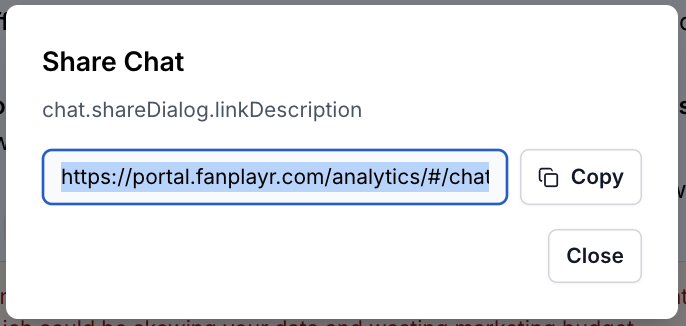 Share Modal
Feedback
You can provide feedback on AI responses, such as marking a response helpful or not helpful. This can help improve future results.
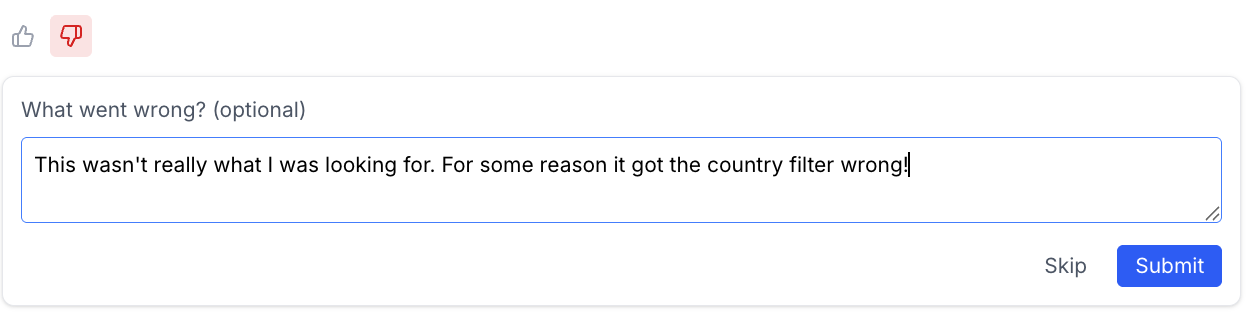 Thumbs up / Thumbs down feedback
Best Practices
- Start with a simple question, then narrow the scope
- Include a timeframe when recency matters
- Be specific about the metric and dimension you want
- Review generated Charts before sharing them
- Use Playground for fine-tuning
- Use Dashboards when you want to preserve or present results
Limitations
- Verada AI Chat may misunderstand ambiguous prompts
- Some questions may require follow-up clarification
- Generated Charts may need manual refinement
- Results depend on the data available in your Insights environment
- Empty or incomplete data can limit the analysis
WARNING
Verada AI Chat should support analysis, not replace validation. Always verify important findings, especially before distributing reports or making business decisions.
Troubleshooting
I’m Not Getting The Chart I Expected
Try:
- Rewriting the prompt more specifically
- Naming the metric and breakdown explicitly
- Adding a timeframe
- Opening the result in Playground and adjusting it manually
The Response Looks Too Broad
Try narrowing the question:
- Instead of: "Show performance"
- Use: "Show conversion rate by device type for the last 30 days"
The Chat Shows No Data
Possible reasons:
- There is no data for the selected query or date range
- The requested combination of fields is too narrow
- Filters or access rules limit what is available