Merchandising Dashboard Documentation
The Merchandising Dashboard provides a centralized view of how Fanplayr’s recommendation services are performing on your site. This includes high-level metrics, detailed conversion data, and performance breakdowns by widget or recommendation model—depending on which features are enabled on your account.
You can access the dashboard via the left sidebar in the Merchandising section of the Fanplayr Portal.
Dashboard Overview
The Merchandising Dashboard is split into three key sections, based on the features active in your account:
- Recommendations – General performance of Fanplayr’s AI product recommendation models. Includes insights into user engagement and conversion.
- Personal Shopper – Performance of personalized merchandising widgets powered by the Personal Shopper feature (if enabled).
- Product Tags – Performance of merchandising widgets using the Product Tag List or Product Tag Explorer (if enabled).
Each section shares a similar layout and functionality, including high-level metrics, interactive filters, and detailed aggregation tools.
Structure of Each Dashboard
Each dashboard section consists of the following components:
1. Filters
Located at the top-right of each dashboard, filters allow you to refine the data shown based on:
- Date range
- Device
- Domain
- Recommendation model (When applicable)
- Widget (When applicable)
Filters impact all visualizations and tables below, except for:
- The real-time User Event Snapshot
- "All Time" values
2. User Event Snapshot (Top Section)
At the very top, you'll see real-time user event metrics, which include:
- Product Views
- Add to Carts
- Purchases
INFO
These numbers reflect all activity tracked by Fanplayr, not just those related to Merchandising. They serve as a benchmark to understand how Merchandising fits within your broader user engagement funnel. They also provide insight into the raw event data that powers AI-based features like Frequently Bought Together and Recommended For You.
3. Overview Section
This is the core of the dashboard, showing key performance statistics. You’ll see three key values for each metric:
- Value - The value of that metric with filters applied.
- All Time – The cumulative value of that metric with no filters applied.
- % Change – The percentage difference compared to the previous time period (e.g., last 30 days vs. the prior 30 days).
4. Various Charts & Graphs
Each dashboard has a collection of graphs, tables, and other visualizations that display performance statistics unique to that dashboard.
5. Aggregates Table (Bottom Section)
At the bottom of each dashboard is a powerful Aggregates table. This section allows you to break down performance data across multiple dimensions using the aggregation editor.
Aggregation Options:
- No Aggregation – A single-row summary of all filtered data (similar to the Overview section).
- By Date – See how performance trends over time.
- By Device – Split data by device.
- By Domain – Split data by domain.
- By Model – (Recommendations only) Compare individual model performance.
Pro Tip
Use this tool to identify high-performing models or widgets, uncover trends, and refine your merchandising strategy.
Section Details
Recommendations
This is the default view, and it's available to all accounts with recommendation services enabled.
Key Features:
- Funnels showing product engagement at each stage:
- Recommendations Shown → Products Clicked → Products Added to Cart → Products Purchased
- Metrics on click-through rates (CTR), conversion, and revenue generated
- Aggregation options including Model, Date, Domain, and Device
Use this section to:
- Understand which recommendation models are driving the most engagement and revenue
- Identify drop-off points in the recommendation funnel
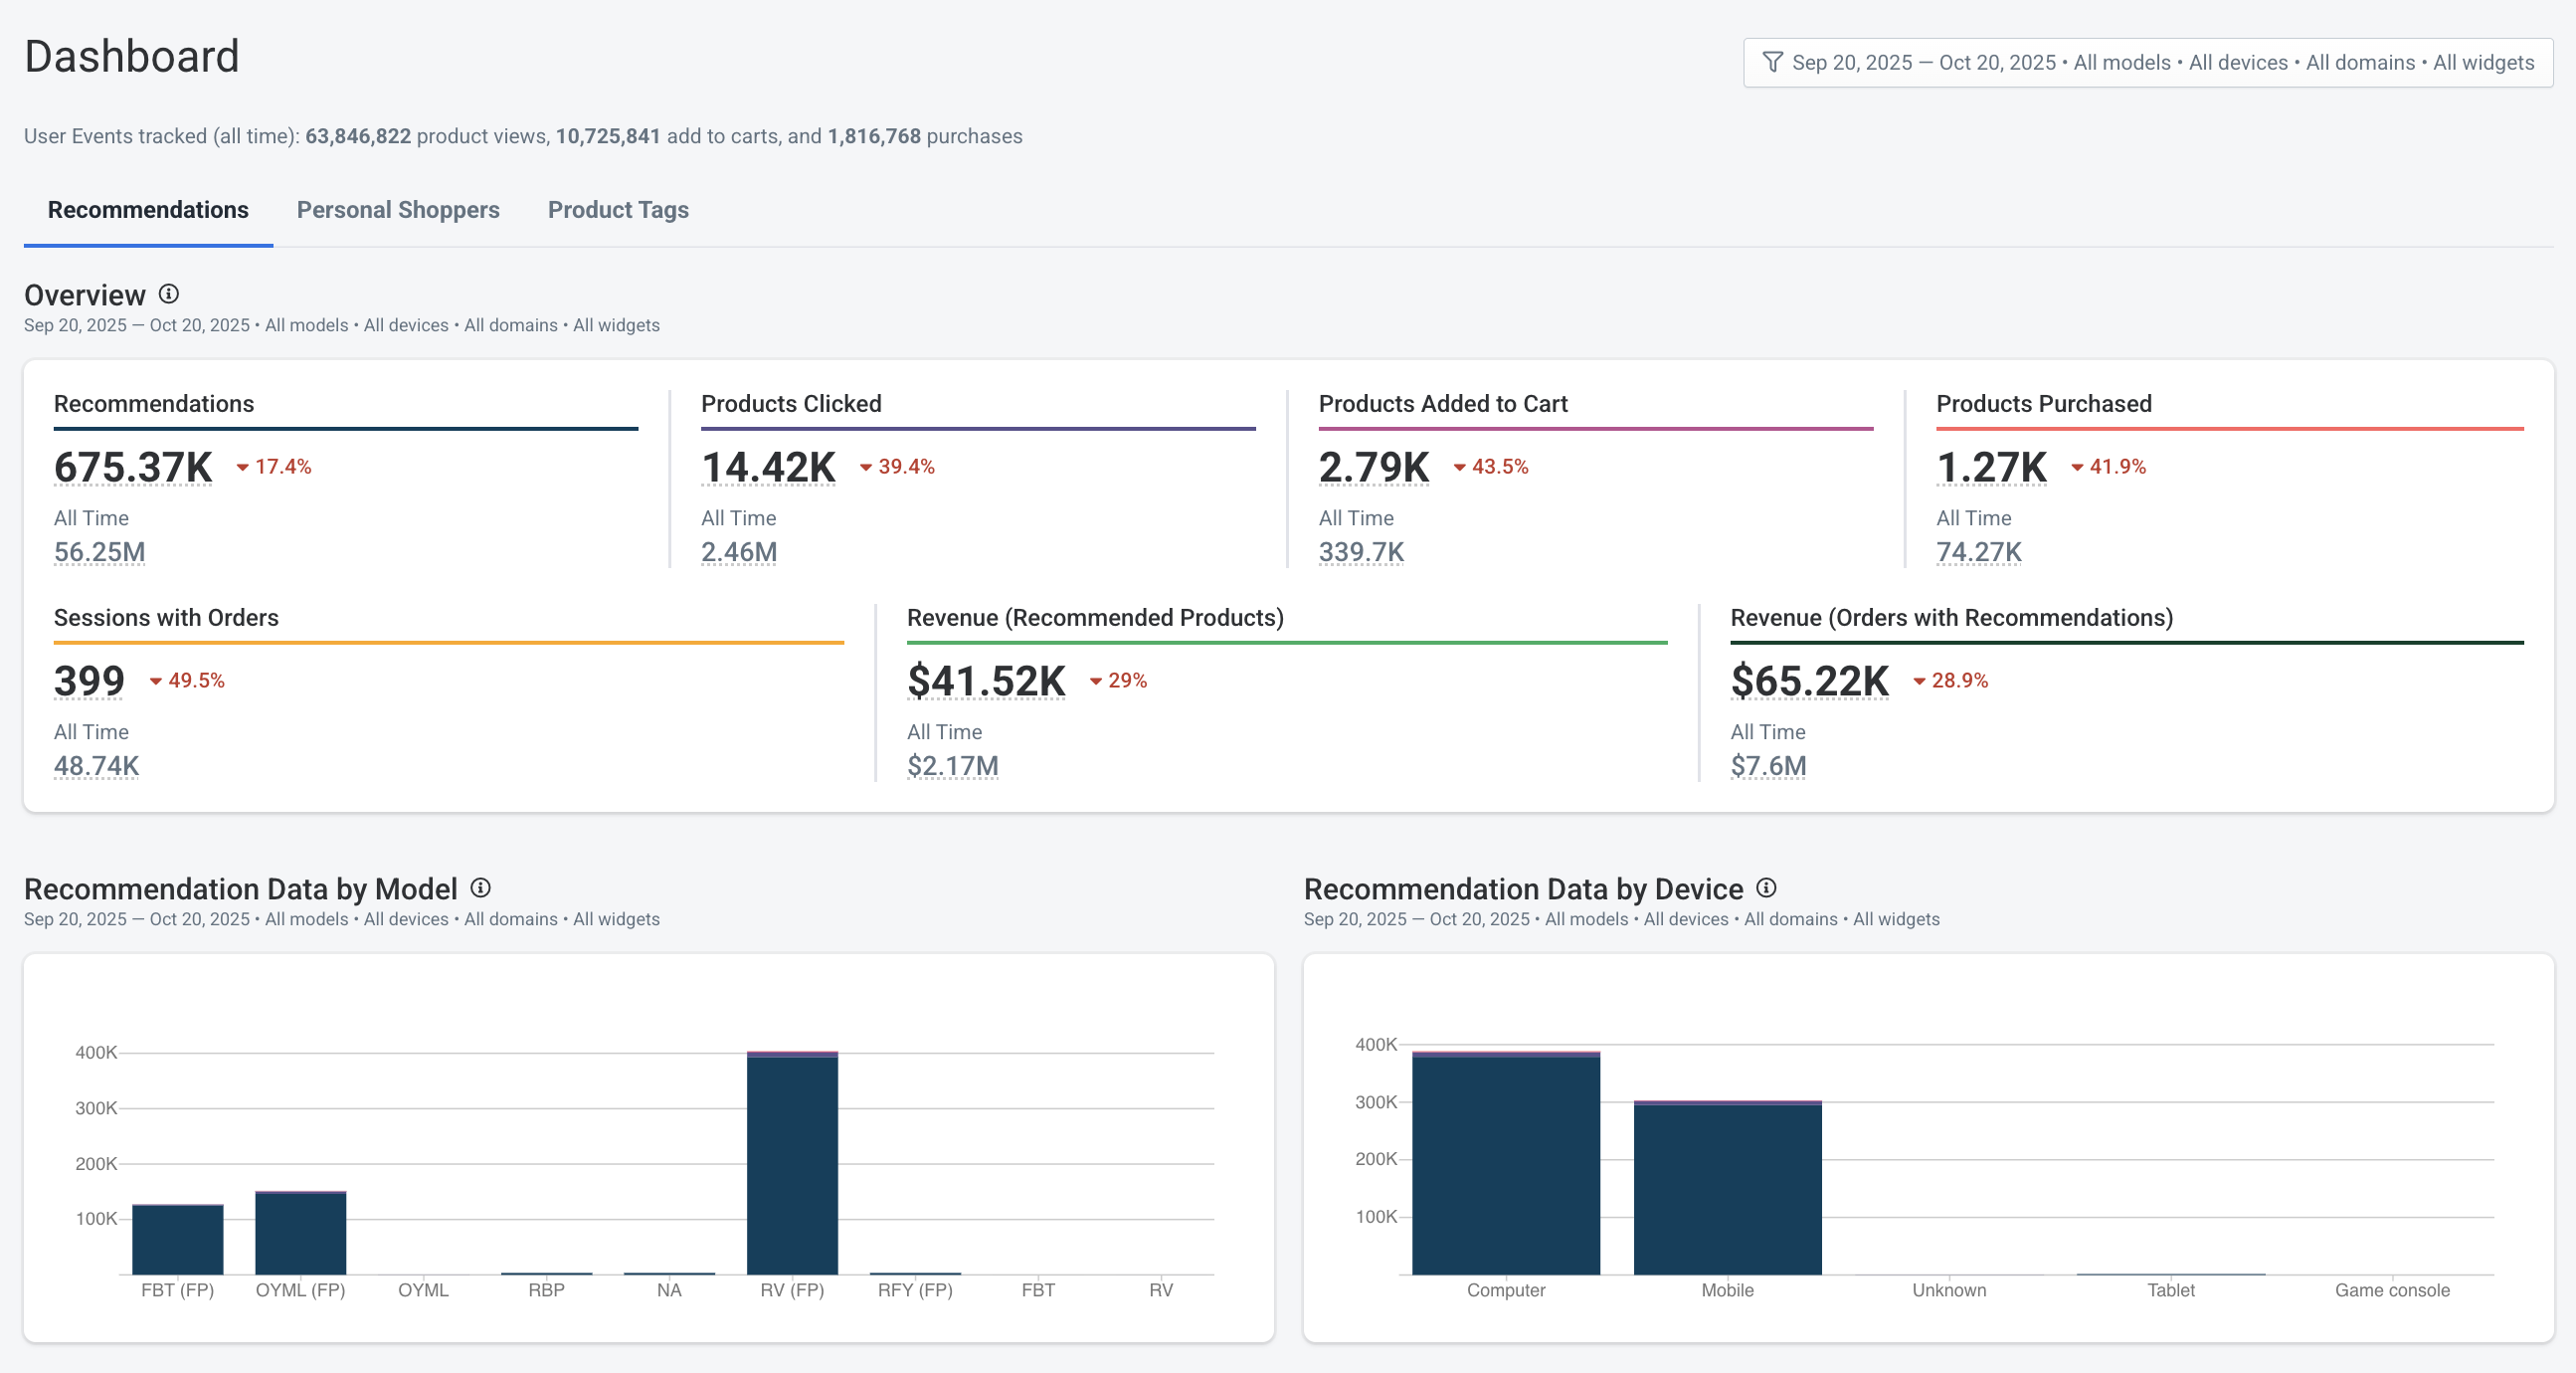 Example Recommendations dashboard
| Property | Description |
|---|---|
| Recommendations | The number of times a model was presented to visitors in a Fanplayr widget. |
| Products Clicked | The number of times a recommended product was clicked. This action directs users to the detailed product page. |
| Products Added to cart | The number of times a recommended product was clicked and then subsequently added to cart. |
| Products Purchased | The number of times a recommended product was clicked and then subsequently added to cart and purchased. |
| Sessions with Orders | The total number of sessions where at least one order was placed containing at least one recommended product. |
| Revenue (Recommended Products) | The total revenue generated from the purchases of recommended products. |
| Revenue (Orders with Recommendations) | The total revenue from orders that contain at least one recommended product. |
Personal Shoppers
This section appears if your account has Personal Shopper enabled.
Key Features:
- Metrics on widget views, clicks, revenue, and conversions solely from your Personal Shoppers
- Aggregation by Date, Device, Domain, etc. (but not by model)
INFO
Because Personal Shopper widgets may display recommendations from multiple models, you cannot filter or break down data by recommendation model.
Use this section to:
- Compare shopper performance across pages or devices
- Optimize placement or content of specific Personal Shopper widgets
- Understand the role Personal Shoppers play in your overall conversion strategy
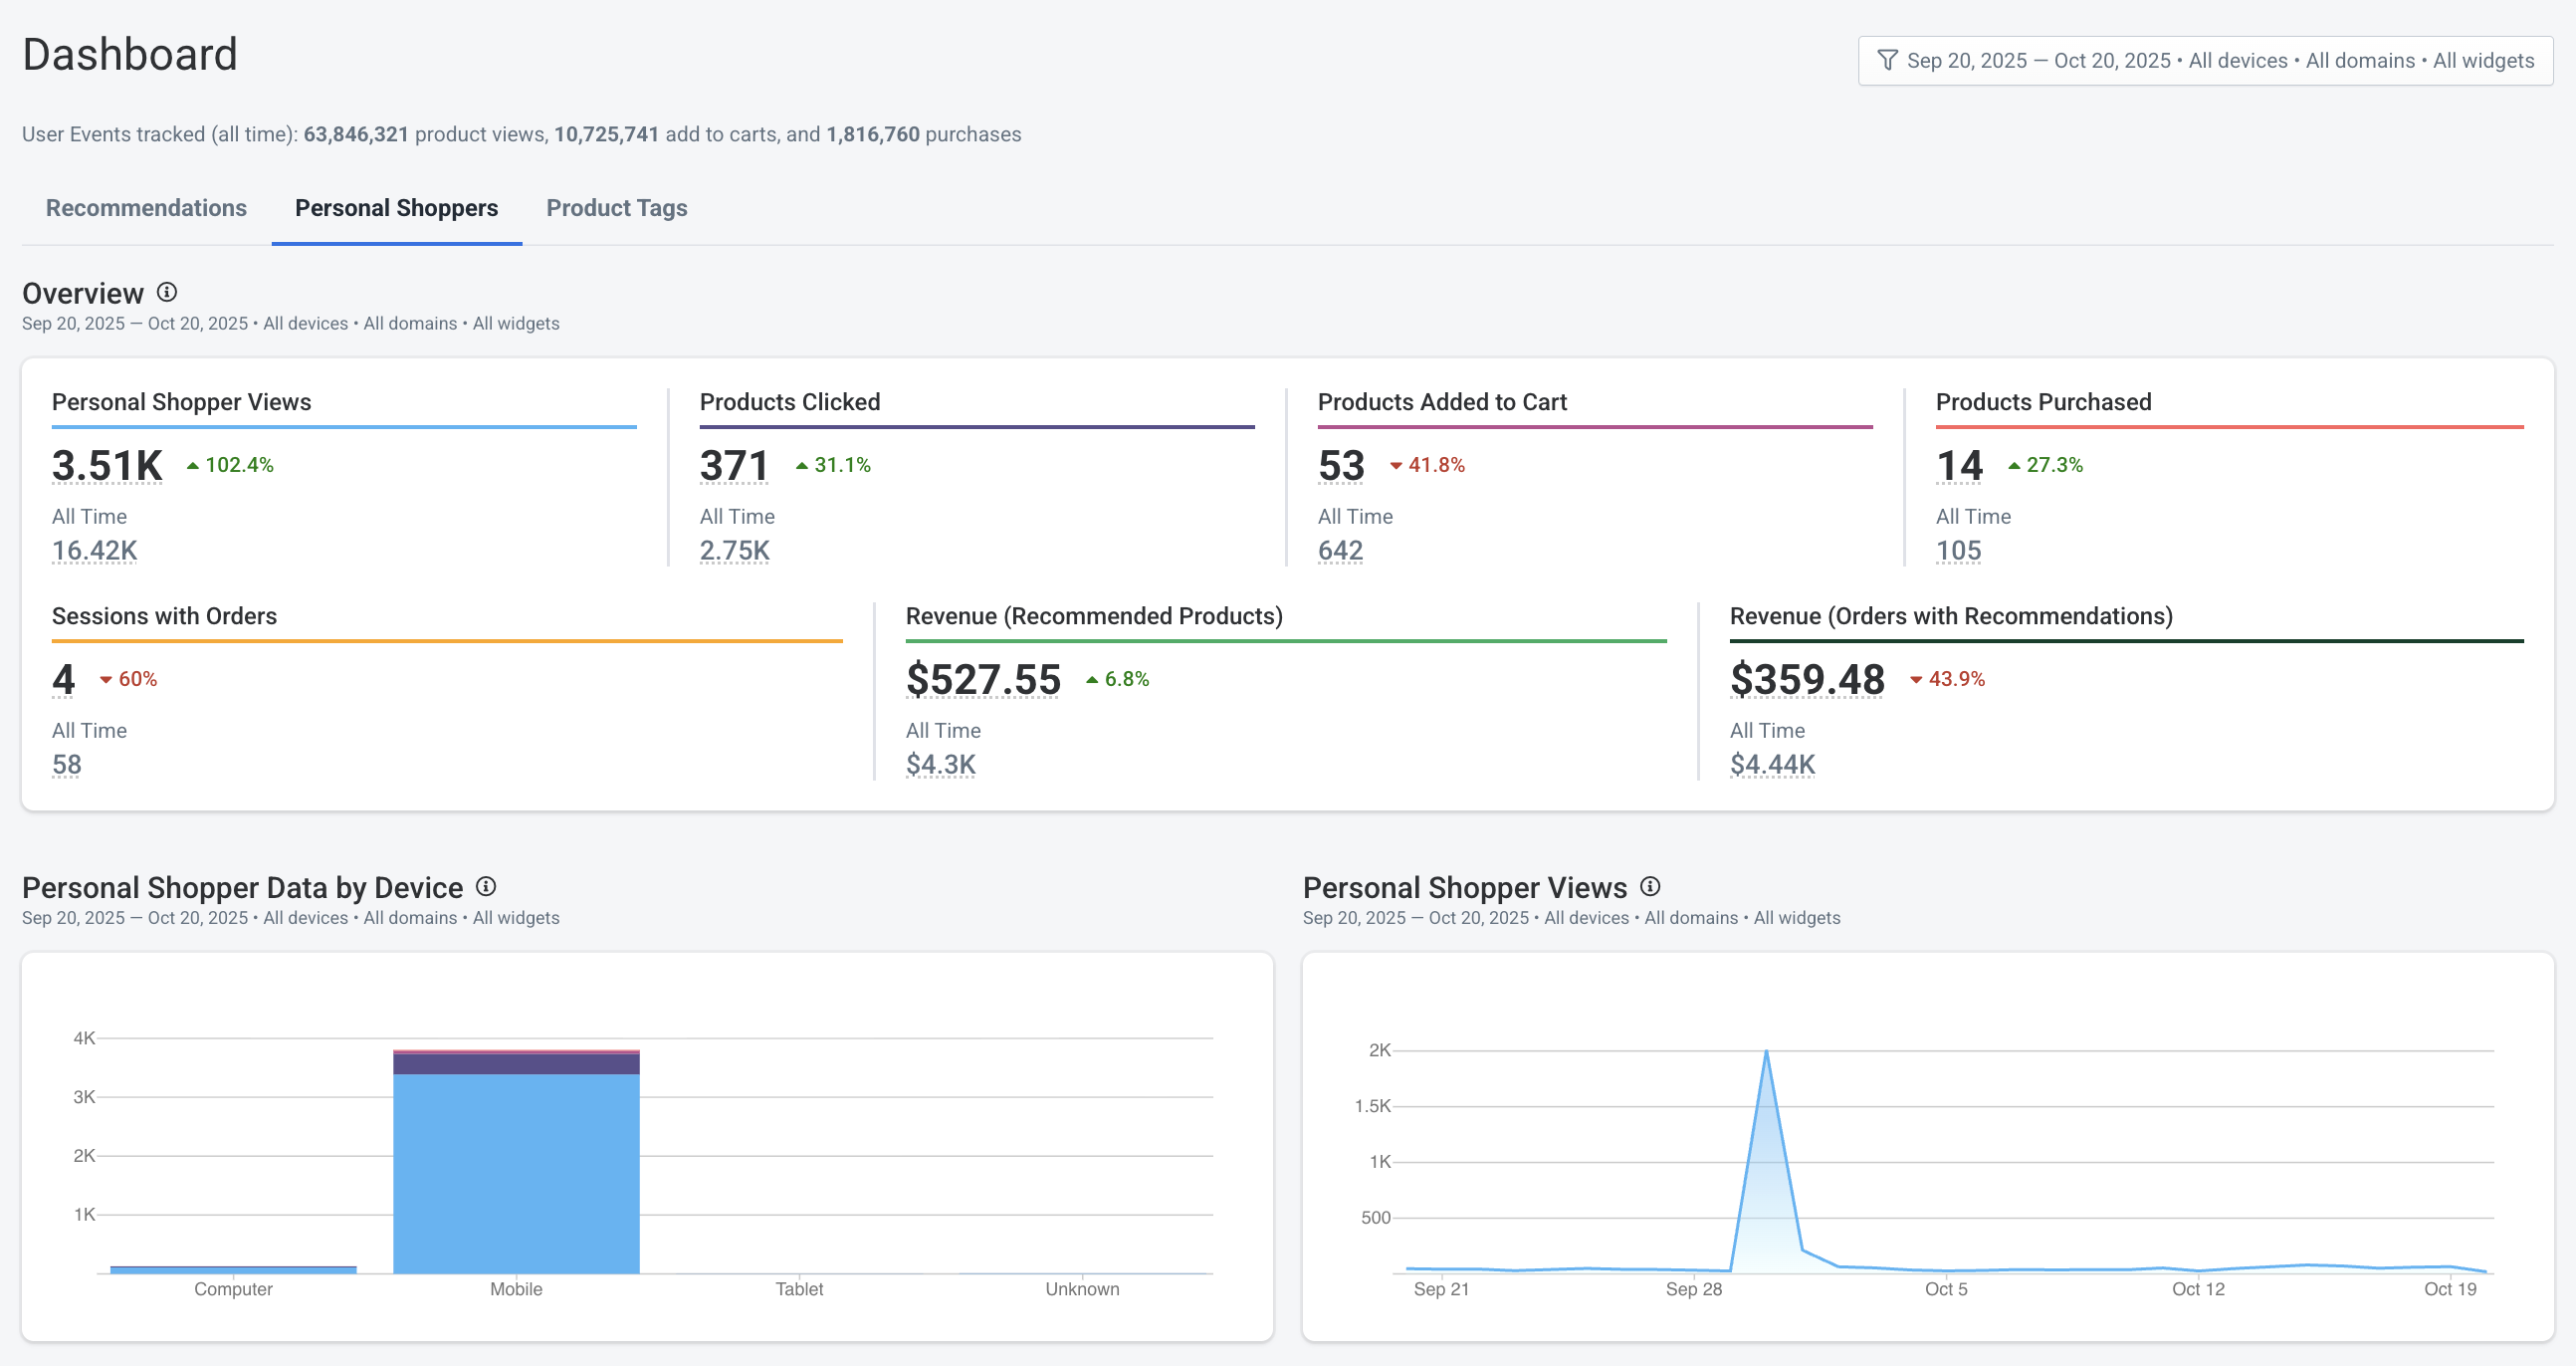 Example Personal Shoppers dashboard
| Property | Description |
|---|---|
| Personal Shopper Views | The number of times a Personal Shopper was presented to your users. |
| Products Clicked | The number of times a recommended product was clicked in a Personal Shopper. This action directs users to the detailed product page. |
| Products Added to cart | The number of times a recommended product was clicked in a shopper and then subsequently added to cart. |
| Products Purchased | The number of times a recommended product was clicked in a shopper and then subsequently added to cart and purchased. |
| Sessions with Orders | The total number of sessions where at least one order was placed containing at least one recommended product that originated in a shopper. |
| Revenue (Recommended Products) | The total revenue generated from the purchases of recommended products in Personal Shoppers. |
| Revenue (Orders with Recommendations) | The total revenue from orders that contain at least one recommended product that originated from a Personal Shopper. |
Product Tags
Available if your account has Product Tags enabled, including Tag Lists and Tag Explorers.
Key Features:
- Metrics similar to the Personal Shopper dashboard (views, clicks, conversions, etc.)
- Product tag click rates
- Data for both Product Tag Lists and Product Tag Explorers
- Aggregation by Date, Page Type, Device, etc. (but not by model)
INFO
As with Personal Shopper, Product Tag + Product Tag Explorer widgets are not tied to a single model, so model filtering is not available.
Use this section to:
- Measure how Product Tags impact user discovery and conversion
- Test different tag groupings or widget placements
- See which tags and products are driving the most revenue or engagement
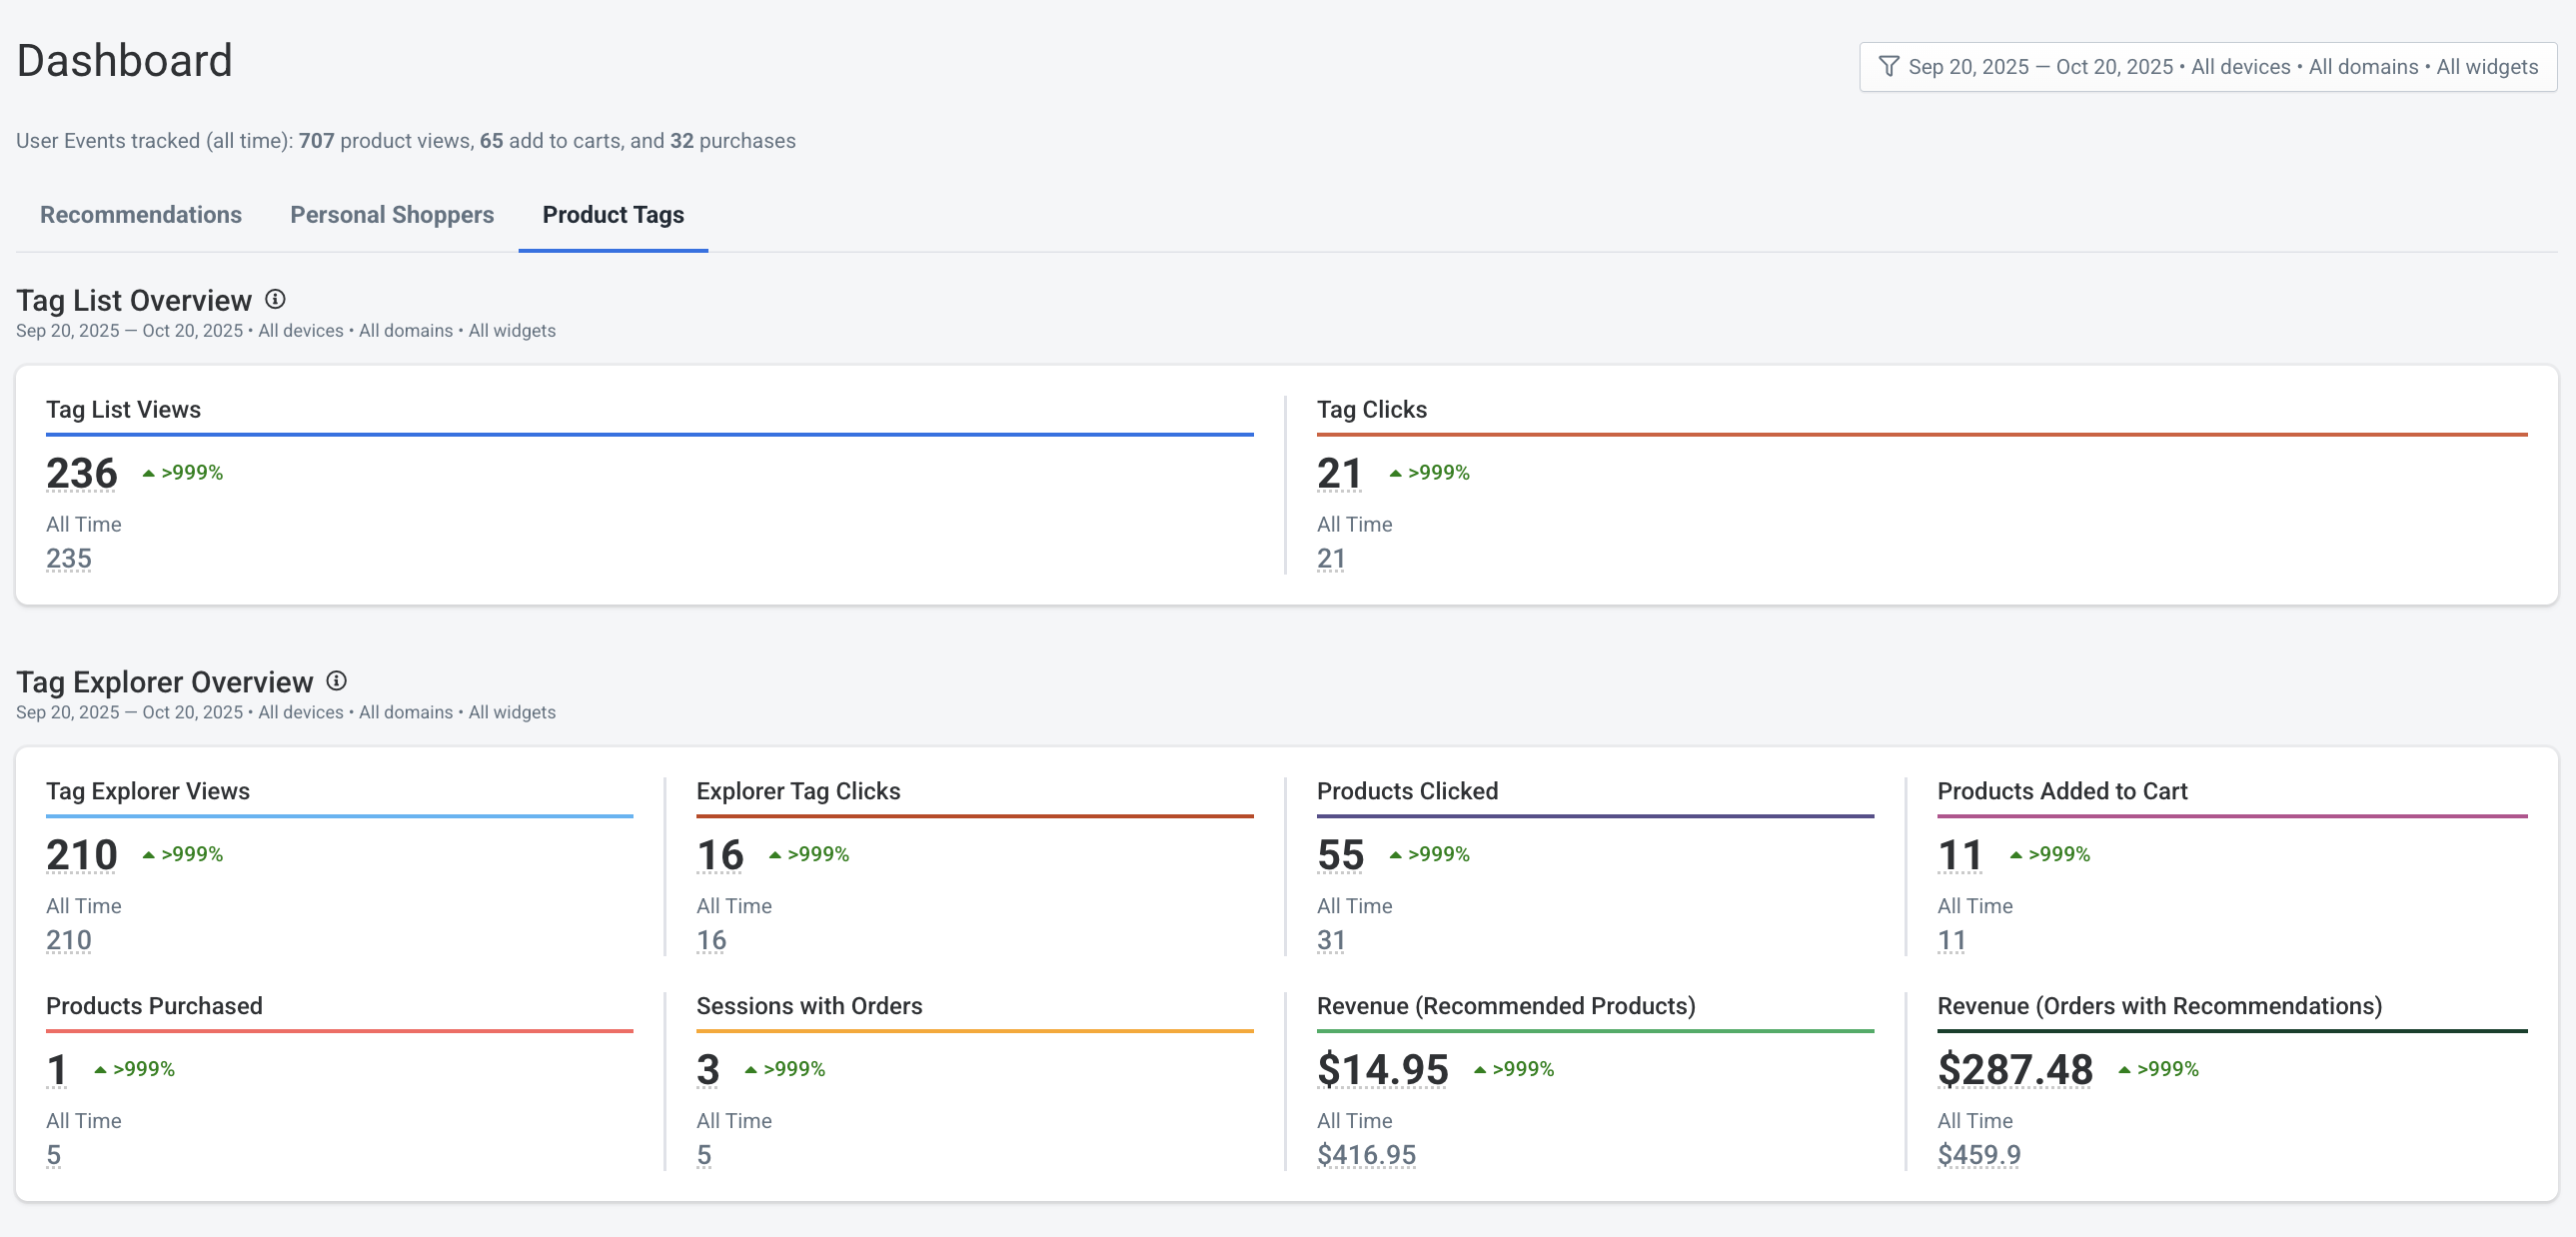 Example Product Tags dashboard
| Property | Description |
|---|---|
| Tag List Views | The number of times a Product Tag List was presented to your users. |
| Tag Clicks | The number of times a product tag was clicked in a Product Tag List widget. |
| Tag Explorer Views | The number of times a Product Tag Explorer was presented to your users. |
| Explorer Tag Clicks | The number of times a product tag was clicked in an Product Tag Explorer widget. |
| Products Clicked | The number of times a product was clicked in a Product Tag Explorer. This action directs users to the detailed product page. |
| Products Added to cart | The number of times a product was clicked in a tag explorer and then subsequently added to cart. |
| Products Purchased | The number of times a product was clicked in a tag explorer and then subsequently added to cart and purchased. |
| Sessions with Orders | The total number of sessions where at least one order was placed containing at least one product that originated in a tag explorer. |
| Revenue (Recommended Products) | The total revenue generated from the purchases of products that originated from a tag explorer. |
| Revenue (Orders with Recommendations) | The total revenue from orders that contain at least one product that originated from a tag explorer. |