Timeline
Introduction
The primary page of the Session Viewer is the session timeline. There are five sub-sections which are described in detail below.
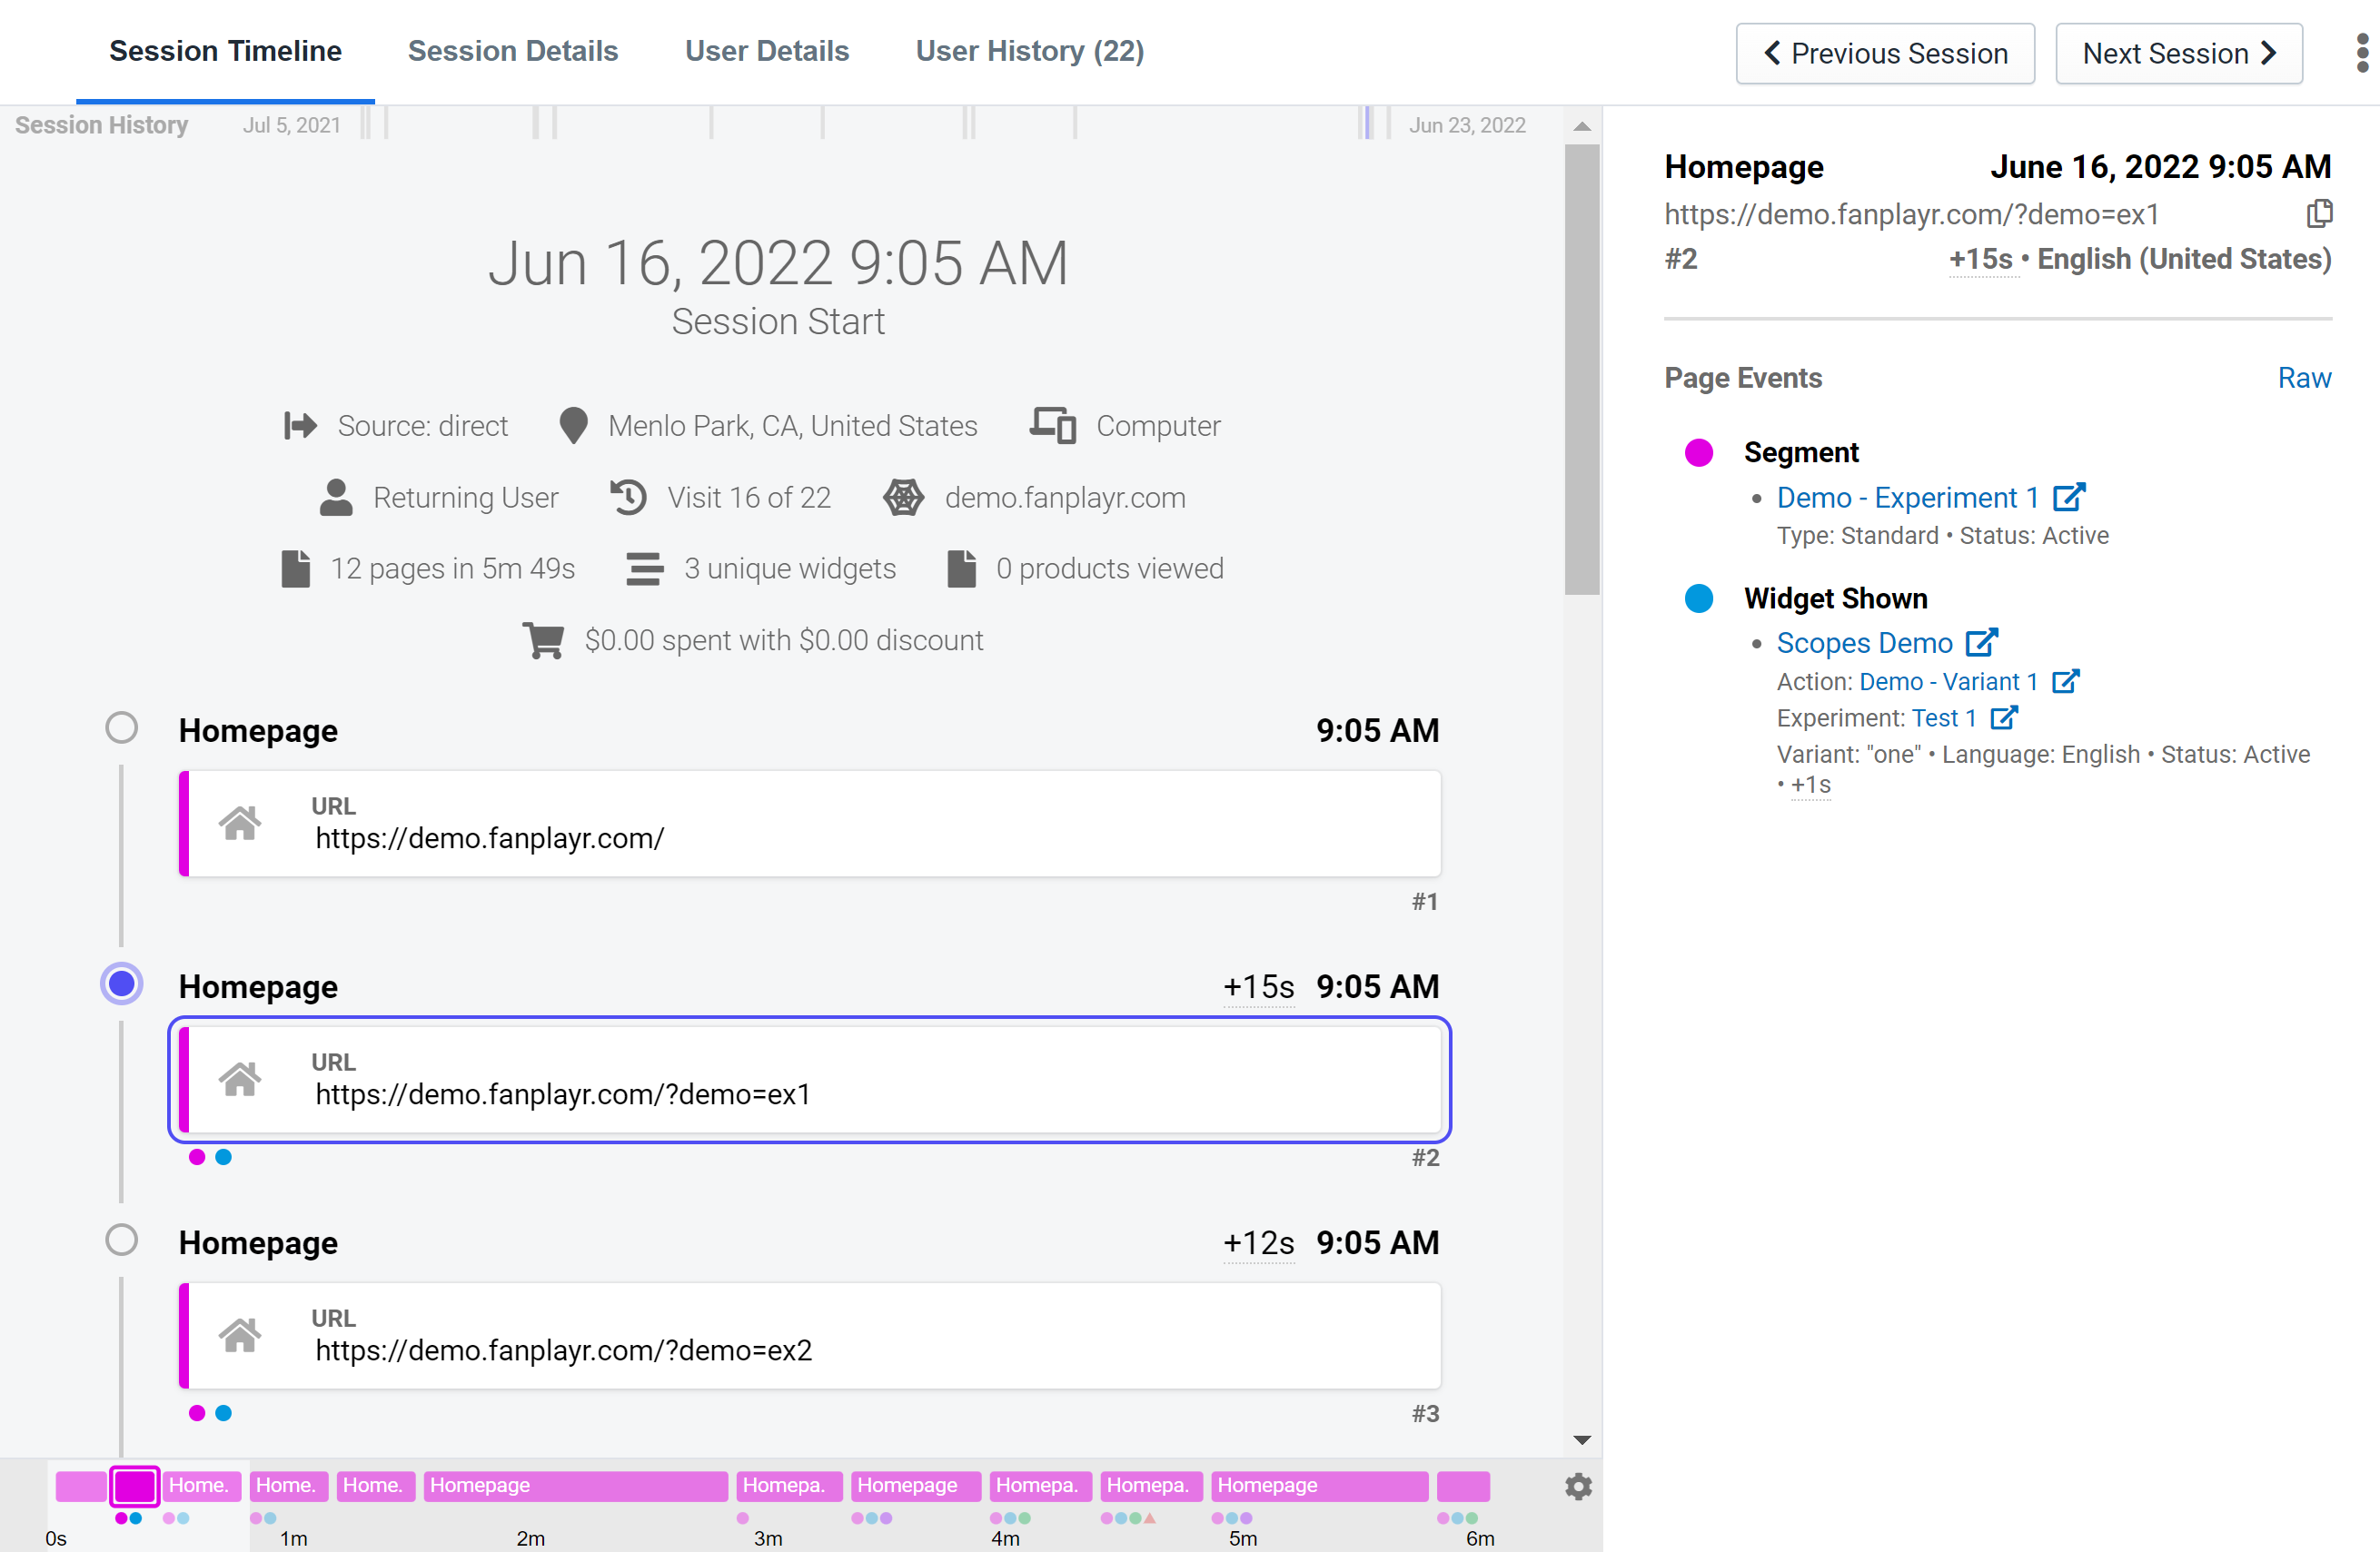 Figure 1: Session Viewer
Session History Mini-Timeline
 Figure 2: Session History Mini-Timeline
At the very top of the timeline section, there is a horizontal mini-timeline with the label "Session History". This time-based timeline shows the user's session history in a simple graph where each tick represents a session. Clicking anywhere in the timeline will bring you to the User History section of the Session Viewer with the closest session to where you clicked automatically selected. The goal of this small timeline is to give you a quick look at the user's past session history and see at a glance the frequency in which this user visits the site.
Timeline Header
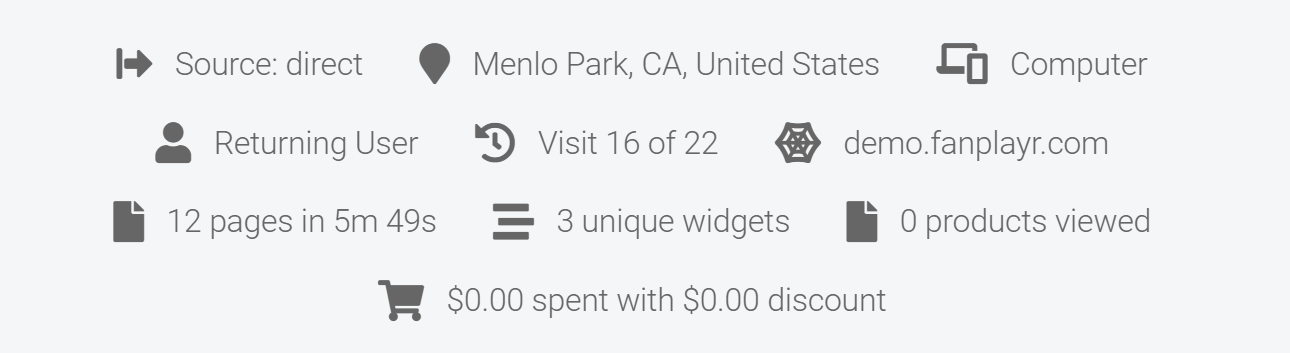 Figure 3: Timeline Header
The header contains some simple information and aggregates of the session. The following information is present in the header:
- Source: This is the source of the user's visit. Some possible sources are SMS, Web Push Notification, Direct, or Email.
- Location: Location is determined using a geolocation of the user's IP address.
- Device Type: Computer, Mobile, or Tablet
- Returning User?: This value is whether or not the user has already visited the site in the past.
- Visit Number: The visit number is the current visit's place in the list of all of the user's visits in chronological order.
- Domain
- Page Views and Time: This value denotes the number of pages visited in this session and total time spent on all pages. This does not include time spent on last page because Fanplayr only tracks time spent per page based on the difference between the load time of two pages and therefore cannot calculate the final page view's time.
- Widgets Shown: This value is the number of unique widgets shown to the user throughout the session.
- Products Viewed: This is the total number of products viewed during the session. If the same product is viewed on two different page views, that will count as two product views in this value.
- Amount Spent and Discount: These values indicate the total gross amount spent during the session and the total discount applied.
- User Is Ignored: This setting will appear if the user is currently being ignored due to prior segmentation.
- A/B Testing: This setting will appear if the campaign has A/B Testing enabled and will indicate whether the user is in the "Control" or "Targeted" group.
Page View Timeline
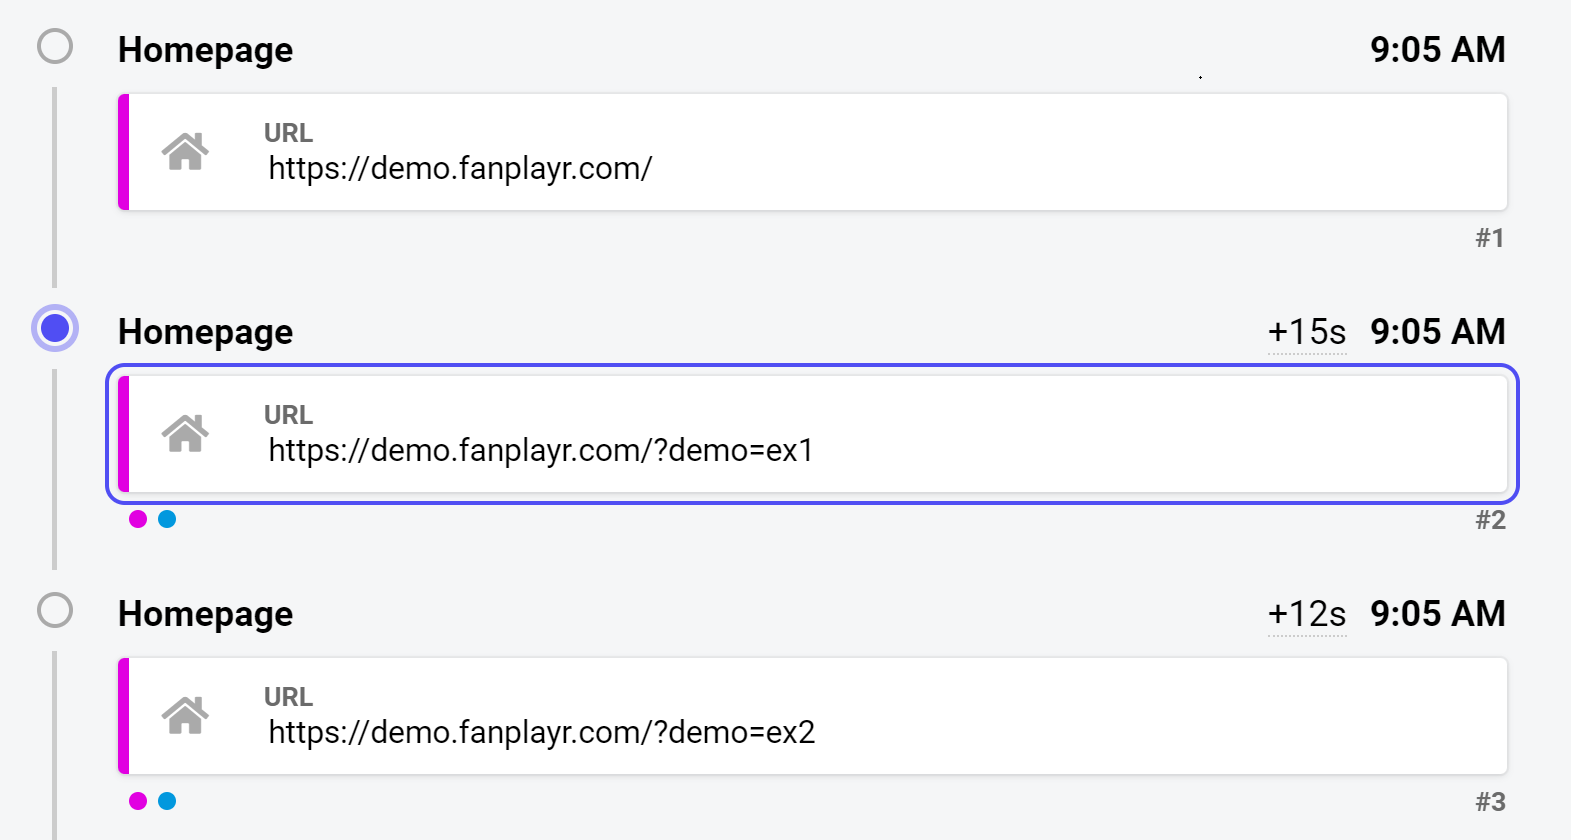 Figure 4: Main Timeline
The center timeline of this section consists of a vertical list of page views in chronological order. The format of each page view in the timeline depends heavily on the page type, which is rendered in bold on the top-left of each timeline item.
The right side of each item shows the time of day when the page view was visited, the duration of time since the previous page view, and the page view index.
Just below each item may be a horizontal list of colorful circles with each representing an action that occurred on that page. To see more, click the timeline entry and view the details in the sidebar.
Below is a list of all page types. For each page view, the type is determined via rules set in the JavaScript adaptor that run against the page's URL.
- Homepage: This is marked as a homepage type and only the URL is shown in the timeline item (pink).
- Blog: This is a blog page and only the URL is shown (black).
- Search: This is a search page where the user searches for products. Only the URL is shown (dark blue).
- Category: This is a product category page, and the timeline item shows the specific page category (dark purple).
- Product: This is a product page, and the timeline item includes some general product information including its picture (light blue).
- Cart: This is a page with the user's cart. The timeline item shows some general aggregate information related to the cart (orange).
- Checkout: This is a checkout page. If an order is attributed to this page, the timeline item will show some general information about the order (dark green).
- Order: This is the page when an order is completed. Occasionally, this is a page that Fanplayr automatically adds when an order takes place. The timeline item shows some general information about the order (red).
- Other: The "Other" page types do not fit into any of the above categories. Only the URL is shown in the timeline item (green).
Page View Mini-Timeline
 Figure 5: Page View Mini-Timeline
Below the major vertical timeline is a miniature horizontal timeline that presents the same page view data in a condensed form. The advantage of this graph is that each bar's length, by default, corresponds to the amount of time the user spent on that page. This feature is often very useful but can occasionally make the graph appear too condensed to read. In this case, the settings button on the right will allow you to switch the graph to a mode that renders bars with equal spacing for better visibility.
The y-axis represents different page types. In general, the lower a bar on the y-axis, the closer the user is to converting. The lowest possible page type in the graph is an order. Only page types visited by the user during the current session will appear in the graph to save space.
Clicking on a bar in the graph will select that page view in the larger timeline above and open the sidebar to show the details of that page.
Sidebar
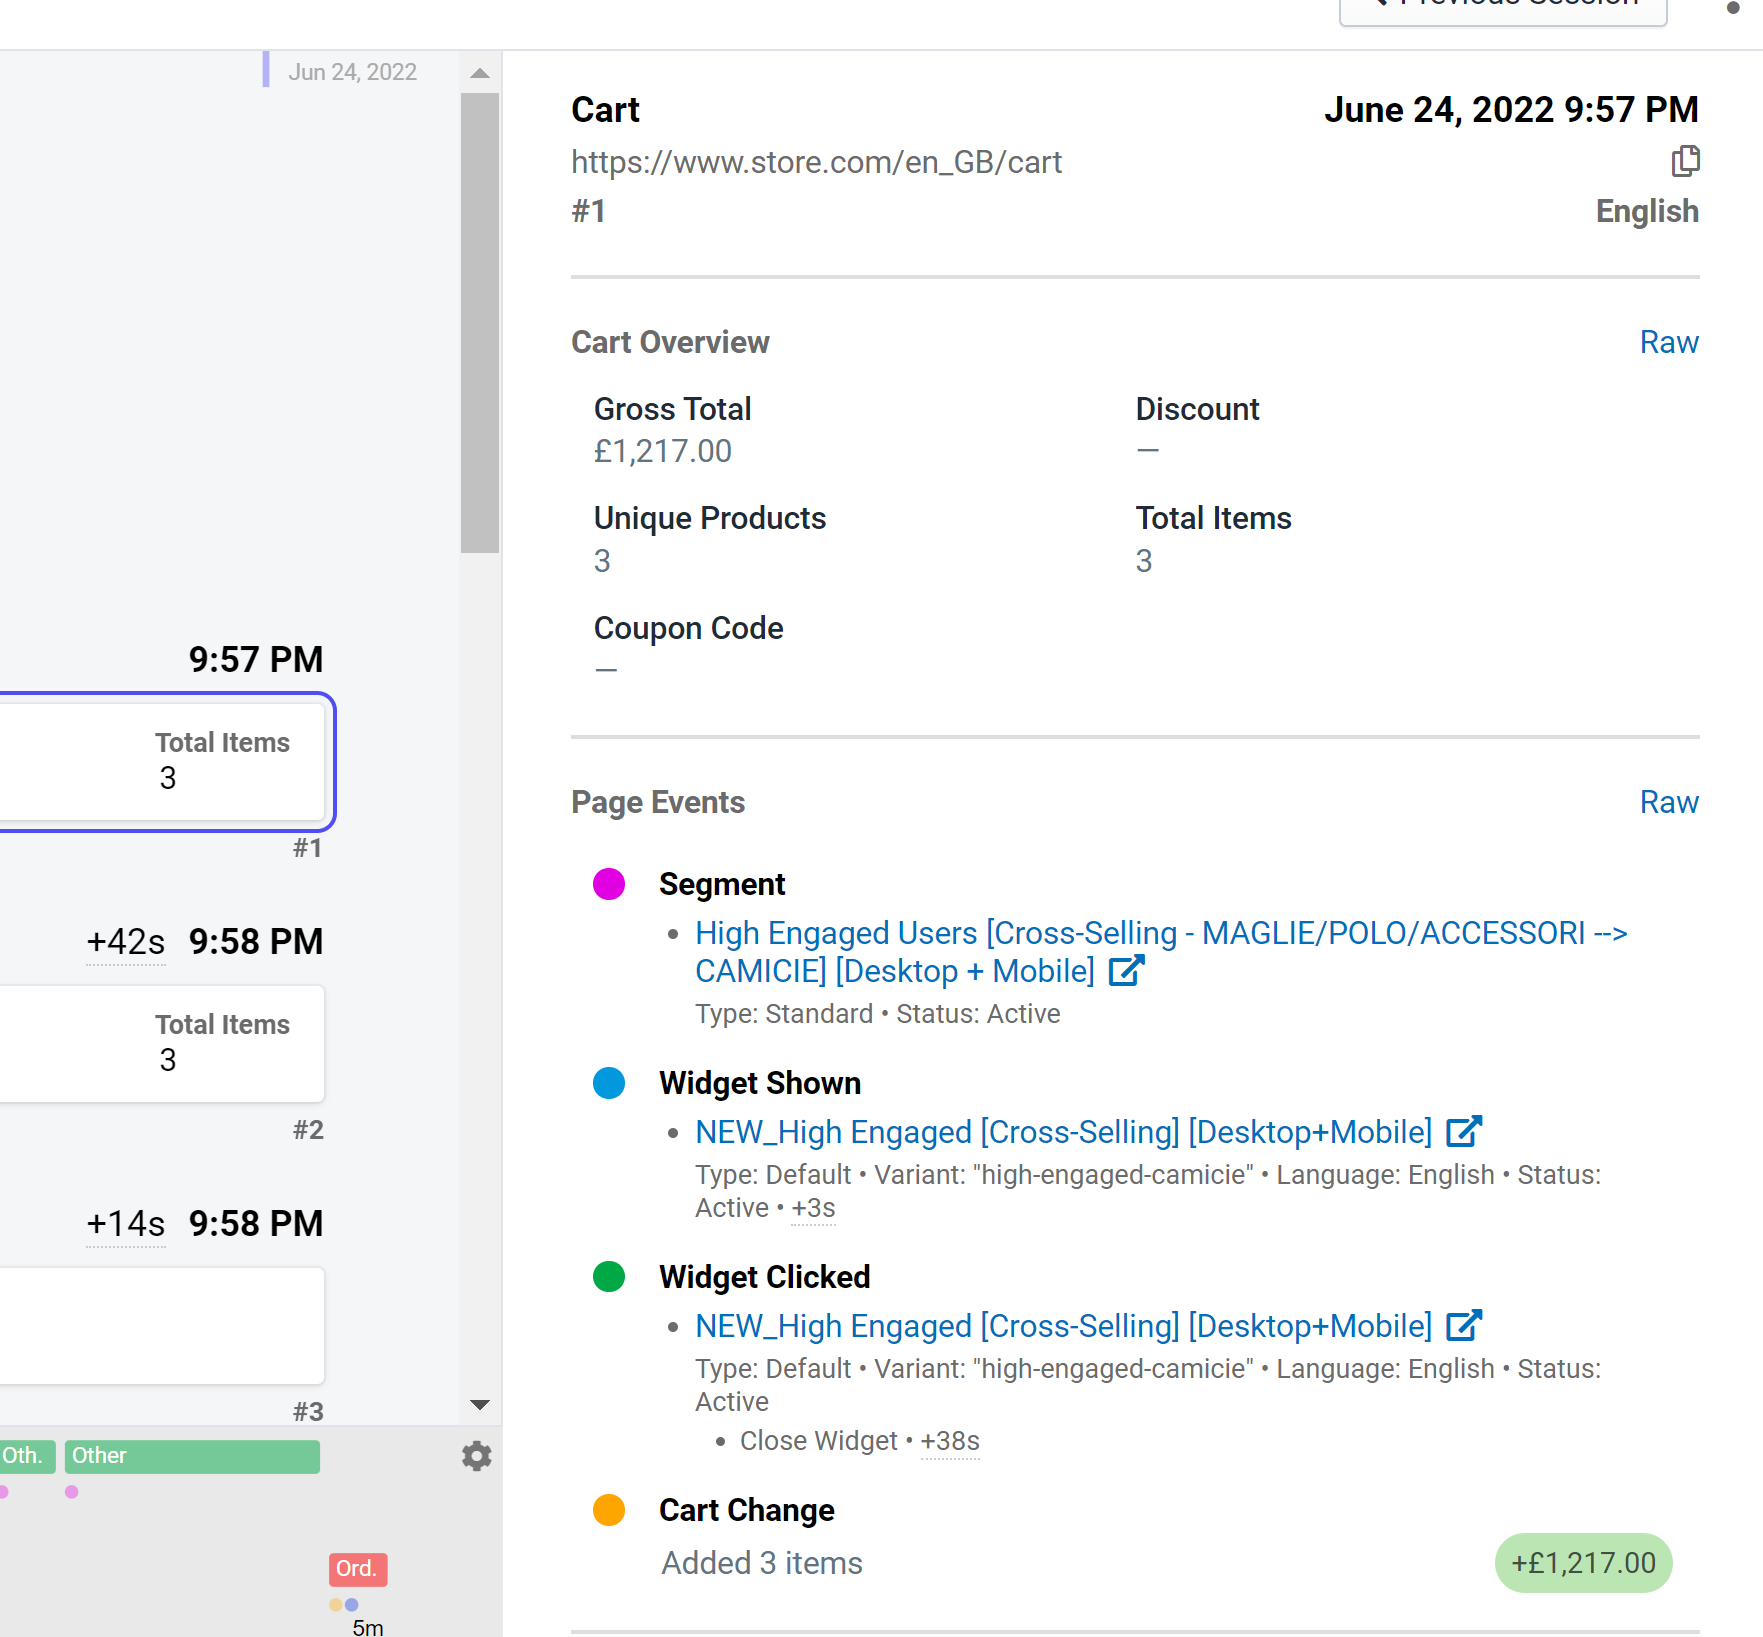
The sidebar on the right side of the screen shows all available details for each page view selected. By default upon load, the first page view in the session will be automatically selected so the specifics of the first page will be shown in the sidebar. As you click through each element in the vertical timeline, the sidebar will be updated to reflect the selected page view.
The following details can be shown in the sidebar if they exist for the selected page view:
- Page Type
- Date
- Language
- URL
- Product Details
- Order Details
- Cart Details
- Page Events
- Widget Shown (blue)
- Widget Clicked (green)
- Widget AFN Tracked (light sky blue)
- Product Recommendation Shown (light orange)
- Product Recommendation Clicked (yellow)
- Segment Triggered (pink)
- Offer Presented + Collected (purple)
- Cart Value Change (orange)
- Coupon Code Applied / Removed (dark blue)
- Page Custom Data
- A/B Testing Information
- Segmentation Exceptions/Conflicts/Errors
- Web Push / SMS Subscription Information
Other Page Events
Occasionally, you may see a section underneath the "Page Events" section called "Other Page Events". These events are denoted by the same color as normal page events, but their corresponding circles are transparent in the center. Events that appear here are due to a specific set of circumstances that result in an event that really occurred on another page view appearing as if it occurred on the current page view. The most common reason for this is described in the example below:
- User visits page (page view 1)
- User opens website in another tab (page view 2)
- User sees widget (or some other event) in original tab (page view 1)
In the situation above, the widget view (for example) will appear as an "other page event" in page view 2. This is because Fanplayr's segmentation system attributes all events to the most recent page view and will apply segmentation rules assuming the widget view occurred on the most recent page view. Because this is a special case, the session viewer differentiates these events from other normal events that actually occurred on the current page view.