Overview Dashboard
The overview dashboard is the standard insights visualization, with useful information on the website overall performance. In all the widgets of the dashboard, the green and the red values represent the performance trend in comparison to the previous time range (i.e. if you selected a time period covering last 30 days it will be compared to the previous 30 days).
Conversion Funnel Widget
It shows the conversion funnel starting from the total visits and then going through non-bounces, unique users and converted users. You can see below some additional data related to converted visits, total orders, total discounts and page views. Data shown here are related to the overall website performance and are not specific of Fanplayr’s campaigns.
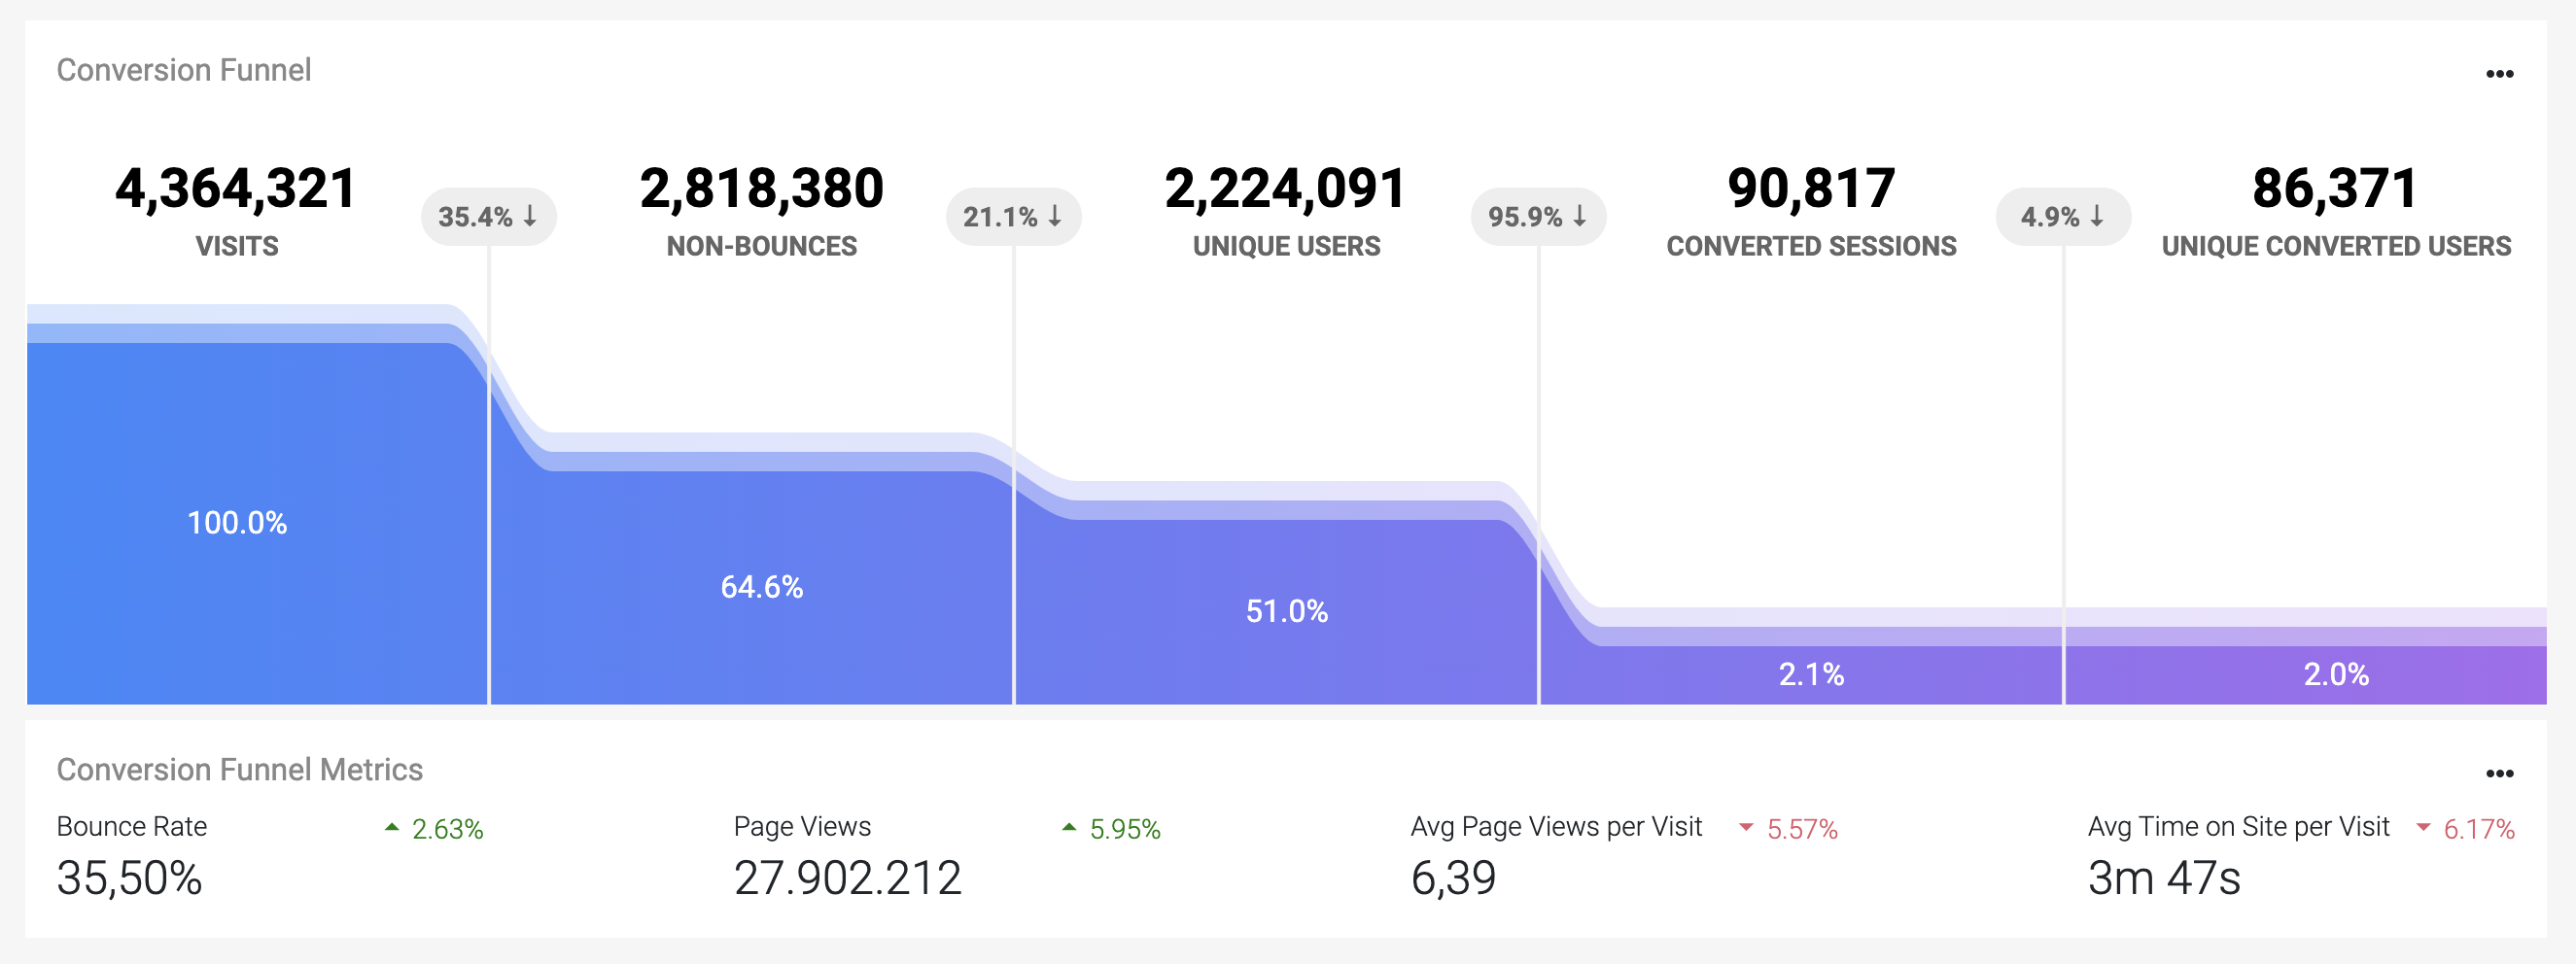
Conversion Funnel and Metrics widgets
Campaign Performance Widget
Differently from the previous widgets, data showed in this widget are related to the Fanplayr’s campaigns during the time range selected. It shows an overview of the number of targeted users and the percentage of them measured versus the total number of non-bounces, the number of redeemed offers and their redemption rate.
.BXwuDZ2i.png) Figure: Campaign Performance Widget
Figure: Campaign Performance Widget
Fanplayr Contribution Widget
This widget shows the estimated Fanplayr’s contribution to net revenues based on the revenue attributable to the increased CR and the increased Fanplayr’s AOV for the conversions using a Fanplayr’s discount code. This is the same calculation shown in the weekly/monthly automated email reports and the exact formula is as follows:
Net revenue contribution → Number of Fanplayr Conversions multiplied by [the increased Fanplayr AOV for these conversions + revenue attributable to increased Conversion Rate]
.CwOG3S8y.png) Figure: Fanplayr Contribution Widget
Figure: Fanplayr Contribution Widget
Orders, Net Revenue & AOV metrics
Here you can see at a glance information on orders, net revenue and AOV with and without Fanplayr and the comparison with the previous time period.
.Ci61Ged8.png) Figure: Orders, Net Revenue & AOV metrics
Figure: Orders, Net Revenue & AOV metrics
Non-Bounces, AOV, Net Revenue & CR charts
The charts shown in the last 4 widgets show the trend over time of the website’s main four KPIs: non-bounces, AOV, net revenue and CR.
.CiIFsRUT.png) Figure: Non-Bounces, AOV, Net Revenue & CR charts
Figure: Non-Bounces, AOV, Net Revenue & CR charts