Query Playground
The Query Playground is a flexible environment for creating, editing, and visualizing behavior-based data queries. Use it to explore user activity, optimize dashboards, or test ideas quickly before saving them as reusable insights.
Structure
 Playground Layout
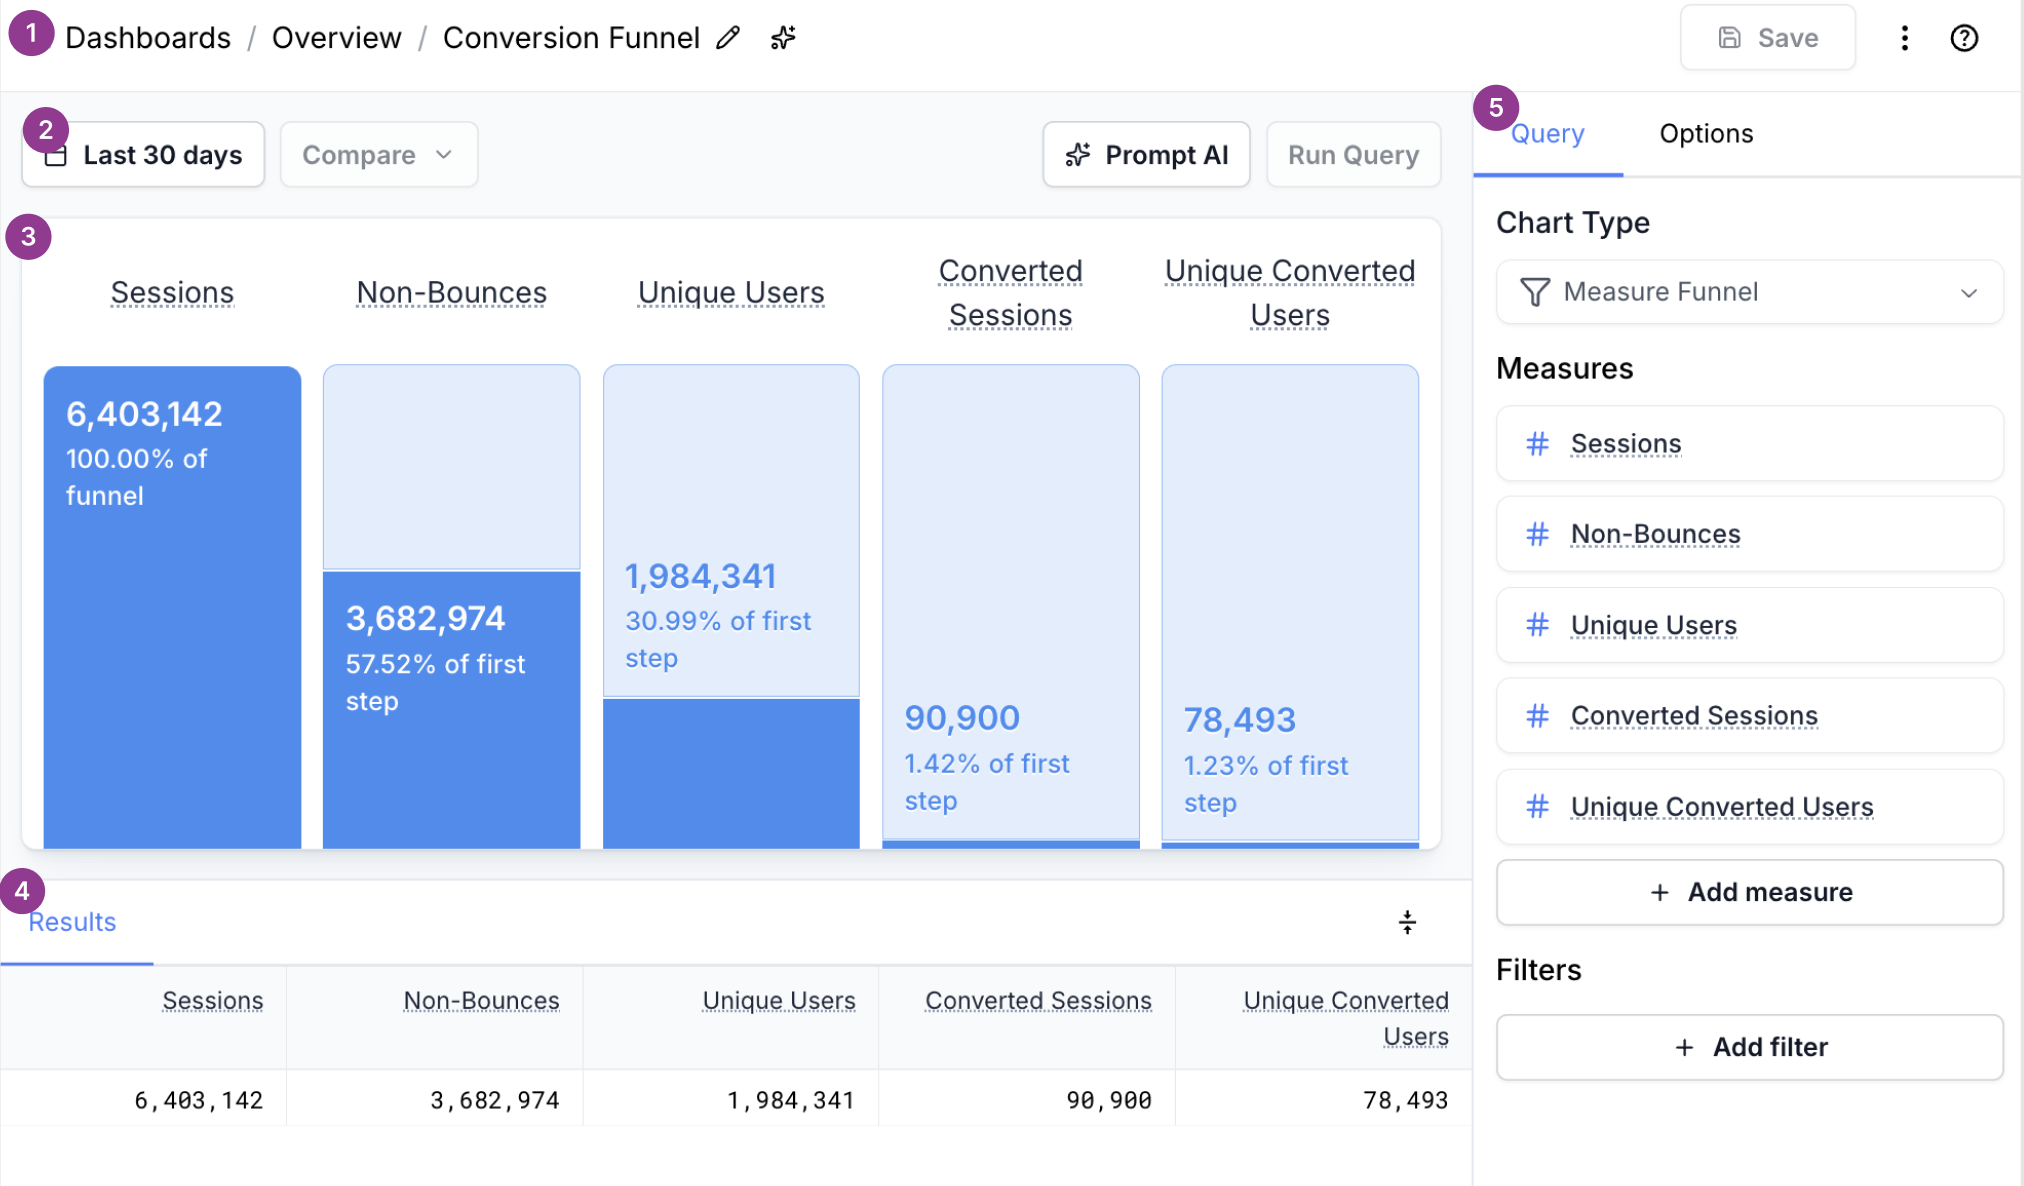
1. Header
Located at the top, the header provides global controls for your query.
Key actions available in the header include:
Rename Query – Click the title to rename your query for easy reference.
Save Query – Save your progress or commit finalized queries for dashboard use.
Copy to Dashboard – Add this query to a dashboard as a new block.
Copy to Account – Add a copy of query to your account.
Access – Adjust sharing settings (only you, view only, account)
Delete – Permanently remove the current query.
Export as CSV – Download the chart data as a CSV file.
Copy Share Link – Generate a shareable link to this query.
Clear Cache & Refresh – Force rerun the query
INFO
Some of the above actions will only be available for queries stored at the account level. Only the user who created the query can modify the access level. Only the creator or an account administrator can delete a saved query.
2. Date Range + Comparison Period
Below the header contains actions that help manage the query.
- Date Range Selector - Define the window of time the data should cover.
- Comparison Period - When enabled, shows a second dataset comparing results from a previous equivalent time range. See Comparison Period below.
- AI Chart Builder - Launch the AI Chart Builder to generate queries via natural language prompts.
- Run Query - Executes the query using the current settings and displays updated results and visualizations.
INFO
If this query is added to a dashboard, the dashboard-level date range (if set) will override the local query date range.
Comparison Period
Optionally, you can choose to compare your results with a previous date period. If selected, the visualization will be augmented to show how your current result set compares with the previous period (sometimes upon hovering over the data). This way you can see how your site's performance has changed over time.
Insights supports the following comparison options:
- Prevous period - Compares to the previous date range identical to the current date range.
- Ex: If current date range is Dec 11 to Dec 20, comparison range becomes Dec 1 to Dec 10.
- Prevous full month - Compares to the previous full month.
- Ex: If current date range is Dec 11 to Dec 20, comparison range becomes Nov 1 to Nov 30.
- Prevous full quarter - Compares to the previous full quarter.
- Ex: If current date range is Dec 11 to Dec 20, comparison range becomes Jul 1 to Sep 30.
- Prevous full year - Compares to the previous date range identical to the current date range.
- Ex: If current date range is Dec 11, 2025 to Dec 20, 2025, comparison range becomes Jan 1, 2024 to Dec 31, 2024.
- Previous 30 Days - Shifts the current date range back 30 days.
- Ex: If current date range is Dec 11 to Dec 20, comparison range becomes Nov 11 to Nov 20.
- Previous 3 months - Shifts the current date range back 3 months.
- Ex: If current date range is Dec 11 to Dec 20, comparison range becomes Sep 11 to Sep 20.
- Previous year - Shifts the current date range back 3 months.
- Ex: If current date range is Dec 11, 2025 to Dec 20, 2025, comparison range becomes Dec 11, 2024 to Dec 20, 2024.
- Custom range: starting on - Uses an arbitrary starting day as the beginning of the comparison date range. The number of days in the comparison period automatically matches the days in the current date period.
- Ex: If current date range is Dec 11 to Dec 20 and the "starting on" date is Mar 3, the comparison range becomes Mar 3 to Mar 12.
- Custom range: ending on - Uses an arbitrary ending day as the end of the comparison date range. The number of days in the comparison period automatically matches the days in the current date period.
- Ex: If current date range is Dec 11 to Dec 20 and the "ending on" date is Mar 3, the comparison range becomes Feb 22 to Mar 3.
- Custom range - Define a completely custom date range to use an the comparison period. This period must end at some date prior to the start date of your current query period.
Fanplayr supports the ability to query for comparison periods that are larger or smaller than the current query date range (ie: this week's data vs the entirely of last year's data). Generally, comparing summation data this way can be misleading, but it can be a handy tool to compare rates and percentages. Keep this in mind.
TIP
Comparison periods are supported by most chart types, but if you see the button disabled, try to switch chart types.
3. Chart Content Area
This section shows the visualized output of your query, such as a column chart, line graph, or table. It's a live preview of what will appear on your dashboard if the query is saved and added to one.
4. Chart Results
For non-table visualizations, this area displays the underlying raw data in tabular format. This data mirrors what is exported when using the Export as CSV function and is helpful for double-checking exact values or doing offline analysis.
5. Sidebar
The sidebar contains everything needed to define what data is pulled and how it is displayed.
Chart Type
Choose the visualization style for your query. Refer to Chart Types for guidance on which styles best suit your data.
INFO
If unsure, start with a table to validate your data selection before switching to a graph or more visual layout.
Measures / Dimensions
The building blocks of your query:
Dimensions – Qualitative fields used to group or segment your data. Examples include
Country,Session End Date,Device Type, orSource.Measures – Quantitative metrics that are aggregated over dimensions. Examples include
Session Count,Conversion Rate,Revenue, andAverage Order Value.
Dimensions determine how data is grouped; measures determine what is being calculated.
For a detailed explanation, see Field Selector.
Filters
Limit the scope of your data by applying filters. These can include user traits, behaviors, device types, locations, and more.
INFO
Filters applied here are combined with any dashboard-level filters. Both must be satisfied for data to appear in the results.
See Filtering Data for more information.
Other Query Options
Depending on your selected chart type and data, additional configuration options may appear in either:
The Query tab
The Options tab
These may include:
Sorting and ordering rules
Result limits (e.g., Top 10 countries)
Custom color schemes
Aggregation strategies (e.g., sum vs. average)
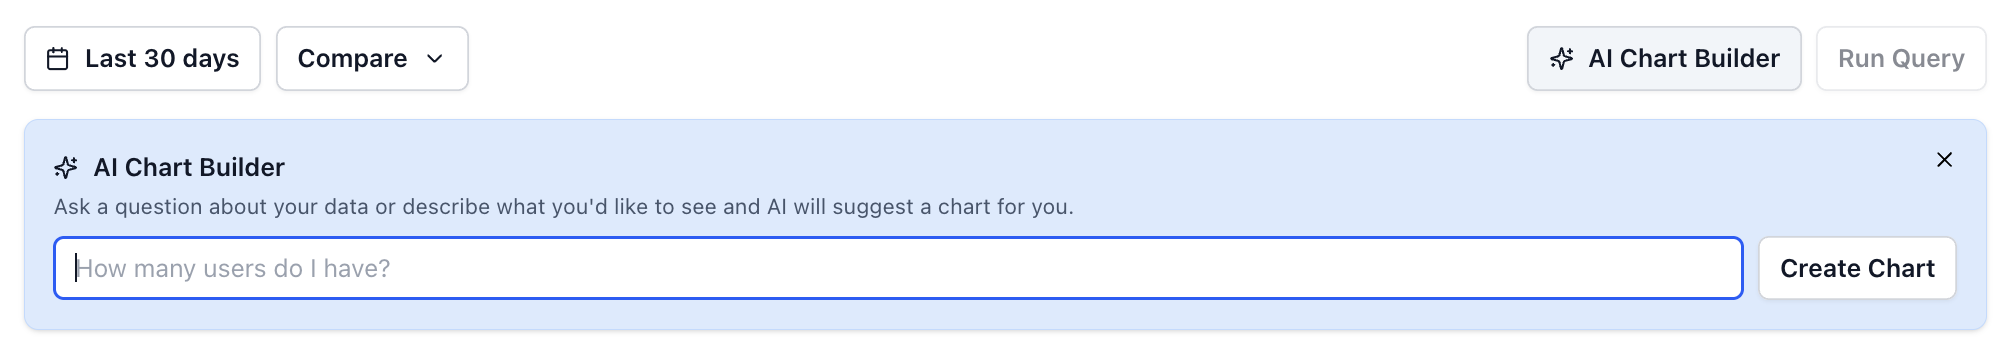
AI Chart Builder
The AI Chart Builder provides a simple way to generate queries using plain language. Powered by Fanplayr’s Verada AI, it interprets your intent and configures dimensions, measures, filters, and chart types for you.
 AI Chart Builder
To use it:
Click AI Chart Builder from the top of the playground.
Enter a prompt describing what you want to see.
Review the auto-configured query.
Click Run Query to execute and preview the results.
Here are a list of potential questions to ask:
- Show me the logical flow of sessions to non-bounces to orders over last 3 months
- For Q1 2024, show me total page views by day and compare to previous period. Filter for users in Mexico
- Show me a table of sessions by country from jan 1 to jan 30, order by most sessions
- Numbers for bounce rate, page views, avg page views, and time on site per user
INFO
Use clear, specific language when describing timeframes, filters, or metrics to get more accurate results.