Field Selector
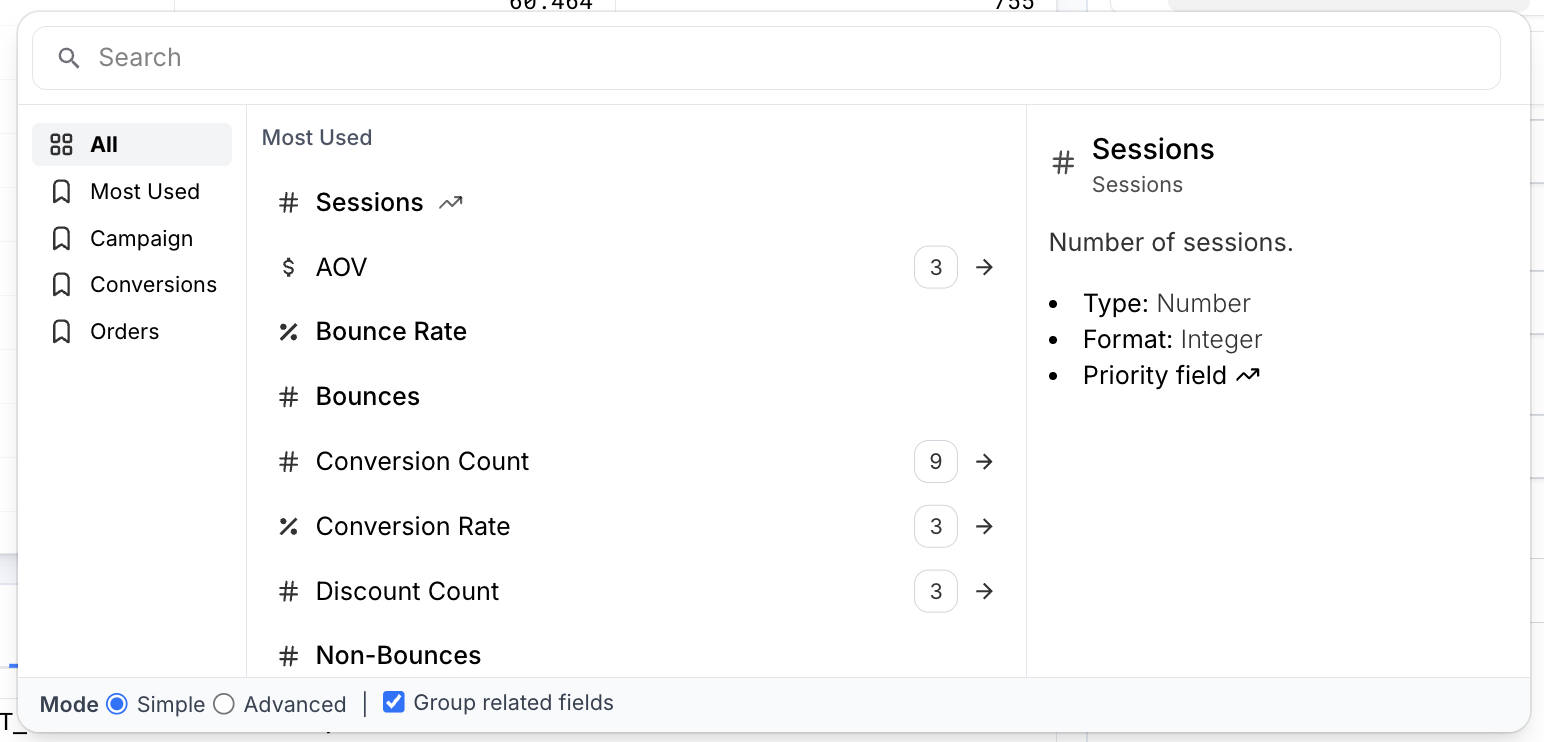
The Field Selector is the tool you use to choose what data your query should analyze or display. Whether you’re adding a measure or a dimension in the Query Playground, the Field Selector helps you locate, preview, and add the right fields.
 Field Selector
In the selector interface, you can either:
Search for a field by name (e.g., Sessions, Country, Revenue per Visit)
Browse the full list of available fields, grouped by category
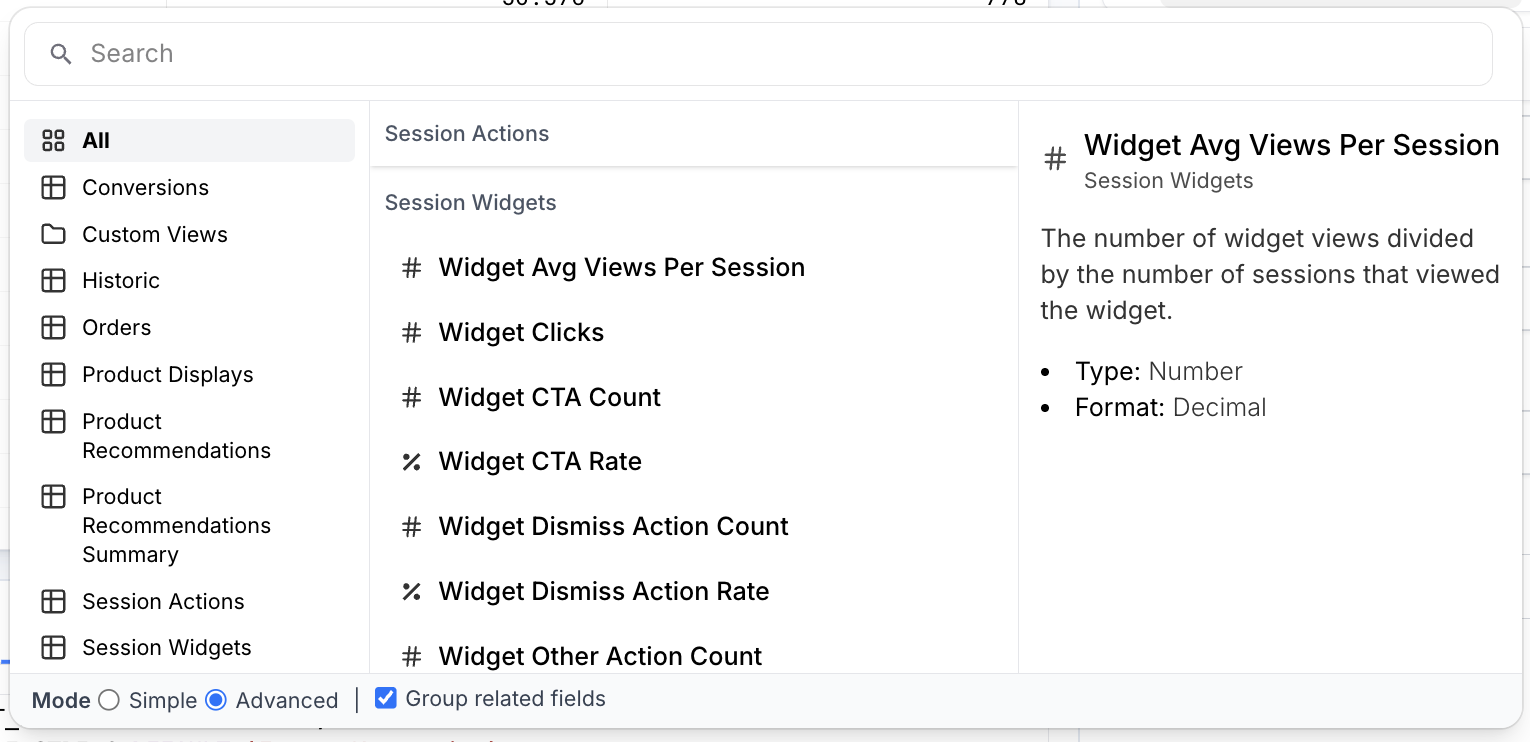
By default, fields are categorized to help you quickly locate those commonly used. However by clicking the "Advanced" mode at the bottom of the selector, the selector will switch to a style that shows every field, split into more technical categories. If you don't see the field you want in the "Simple" mode, try switching to "Advanced".
In addition to the mode, you can choose to show fields grouped together into similar parent fields (like Conversion Count FP grouped into a general Conversion Count field). Uncheck this to see each field without any additional grouping.
 Advanced Mode
TIP
Special field categories are made available in "Advanced" mode depending on what is enabled on the account. This can include custom SQL reports, specialized Site Speed reports, and more.
Smart Field Compatibility
The Field Selector is context-aware and adapts based on what you’ve already selected in your query.
✅ Compatible Fields will appear normally and are safe to add to your query.
🚫 Incompatible Fields will be grayed out or hidden to prevent logic conflicts or unsupported combinations.
This automatic filtering helps prevent misconfigured queries by ensuring that selected dimensions and measures can be aggregated and visualized together.
Custom Fields
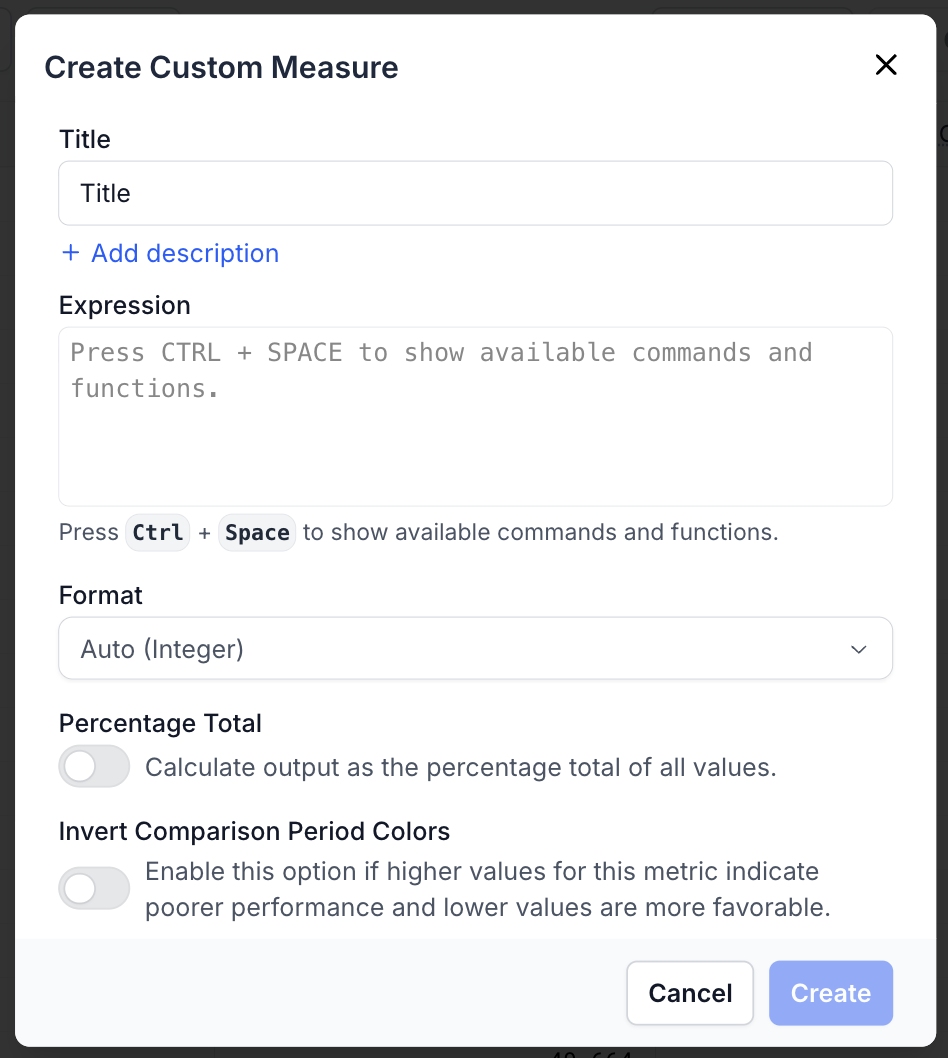
You can also define your own custom measures and dimensions using a built-in expression editor.
 Custom Measure
To create a custom field:
Click "Add measure" or "Add dimension" to start the process of adding a new field.
Click the "+ Create" button at the top right of the field selector.
In the modal that appears:
Enter a name and optional description
Build your expression using the expression editor
- Press Ctrl + Space to browse available functions and existing fields
Choose a display format (e.g., numeric, percentage, currency)
Expression Functions
When building an expression, you can press "CTRL + SPACE" to bring up a dropdown. Use this to add a field into your expression. In addition, you have access to the following functions:
ABS- Absolute value of the value- EX:
ABS(-1) => 1
- EX:
CEIL- Rounds a number up to the next integer- EX:
CEIL(12.24) => 13
- EX:
FLOOR- Rounds a number down to the next integer- EX:
FLOOR(14.9) => 14
- EX:
SQRT- Returns square root of number- EX:
SQRT(64) => 8
- EX:
ROUND- Rounds a number to the nearest integer- EX:
ROUND(24.43) => 24
- EX:
LOWER- Converts string to lowercase- EX:
LOWER('Fanplayr') => 'fanplayr'
- EX:
UPPER- Converts string to lowercase- EX:
UPPER('Fanplayr') => 'FANPLAYR'
- EX:
GREATEST- Returns largest value in list of numbers- EX:
GREATEST(1, 2, 3) => 3
- EX:
GREATEST- Returns smalest value in list of numbers- EX:
LEAST(1, 2, 3) => 1
- EX:
IFNULL- Returns first non-null value- EX:
IFNULL(NULL, 'hello') => 'hello'
- EX:
SPLIT- Splits a string into substrings based on a delimiter and returns the part at the specified index (zero-based).- EX:
SPLIT('Hello,World', ',', 1) => 'World'
- EX:
CONCAT- Combines strings together to build larger string- EX:
CONCAT('Hi', ' ', 'Fanplayr') => 'Hi Fanplayr'
- EX:
IF- Executes a simple if condition and returns one of two results- EX:
IF('123' === '123', 'Hi', 'Bye') => 'Hi'
- EX:
SAFE_DIVIDE- Divides two numbers in a way that will not result in Infinity if the denominator is 0- EX:
SAFE_DIVIDE(10, 0) => NULL
- EX:
Percentage Total Option
You can also toggle Percentage Total to make your custom measure represent the proportion of each row’s value to the total across all rows.
Example:
| Session End Date | Order Net | Custom Order Net % Total |
|---|---|---|
| 2025-01-01 | 152.2 | 22.7% |
| 2025-01-02 | 250.9 | 37.5% |
| 2025-01-03 | 79.1 | 11.8% |
| 2025-01-04 | 187.5 | 28% |
This is especially useful when building stacked charts or when you want to compare relative performance across groups.
TIP
You can create a percentage total custom field quickly by selecting clicking the three dot icon that appears when hovering over a field in the field selector.
Optional Bucketization
For custom dimensions only, you can choose from one of three general types:
Expression - Same as custom measure. Enter a calculation in the text editor.
Dynamically Sized Buckets - Define a dynamic bucket based on a numeric dimension.
Fixed Sized Buckets - Define a bucket of fixed sizes based on a numeric dimension.
Selecting one of the two bucket options will give reveal a few more customization options based on the type of bucketization you want to achieve.
The resulting values will be grouped into buckets as defined in the custom dimension.
Tips for Effective Field Selection
Use the search bar to find metrics quickly by keyword or behavior type.
Be aware that some fields are only available for certain products enabled on your account, and some may be hidden due to compatibility issues.
Start with a table chart to validate your dimensions and measures before applying filters or advanced visualizations.
When using custom fields, test your expression with different dimensions to ensure it aggregates meaningfully.