Appearance
Dashboard
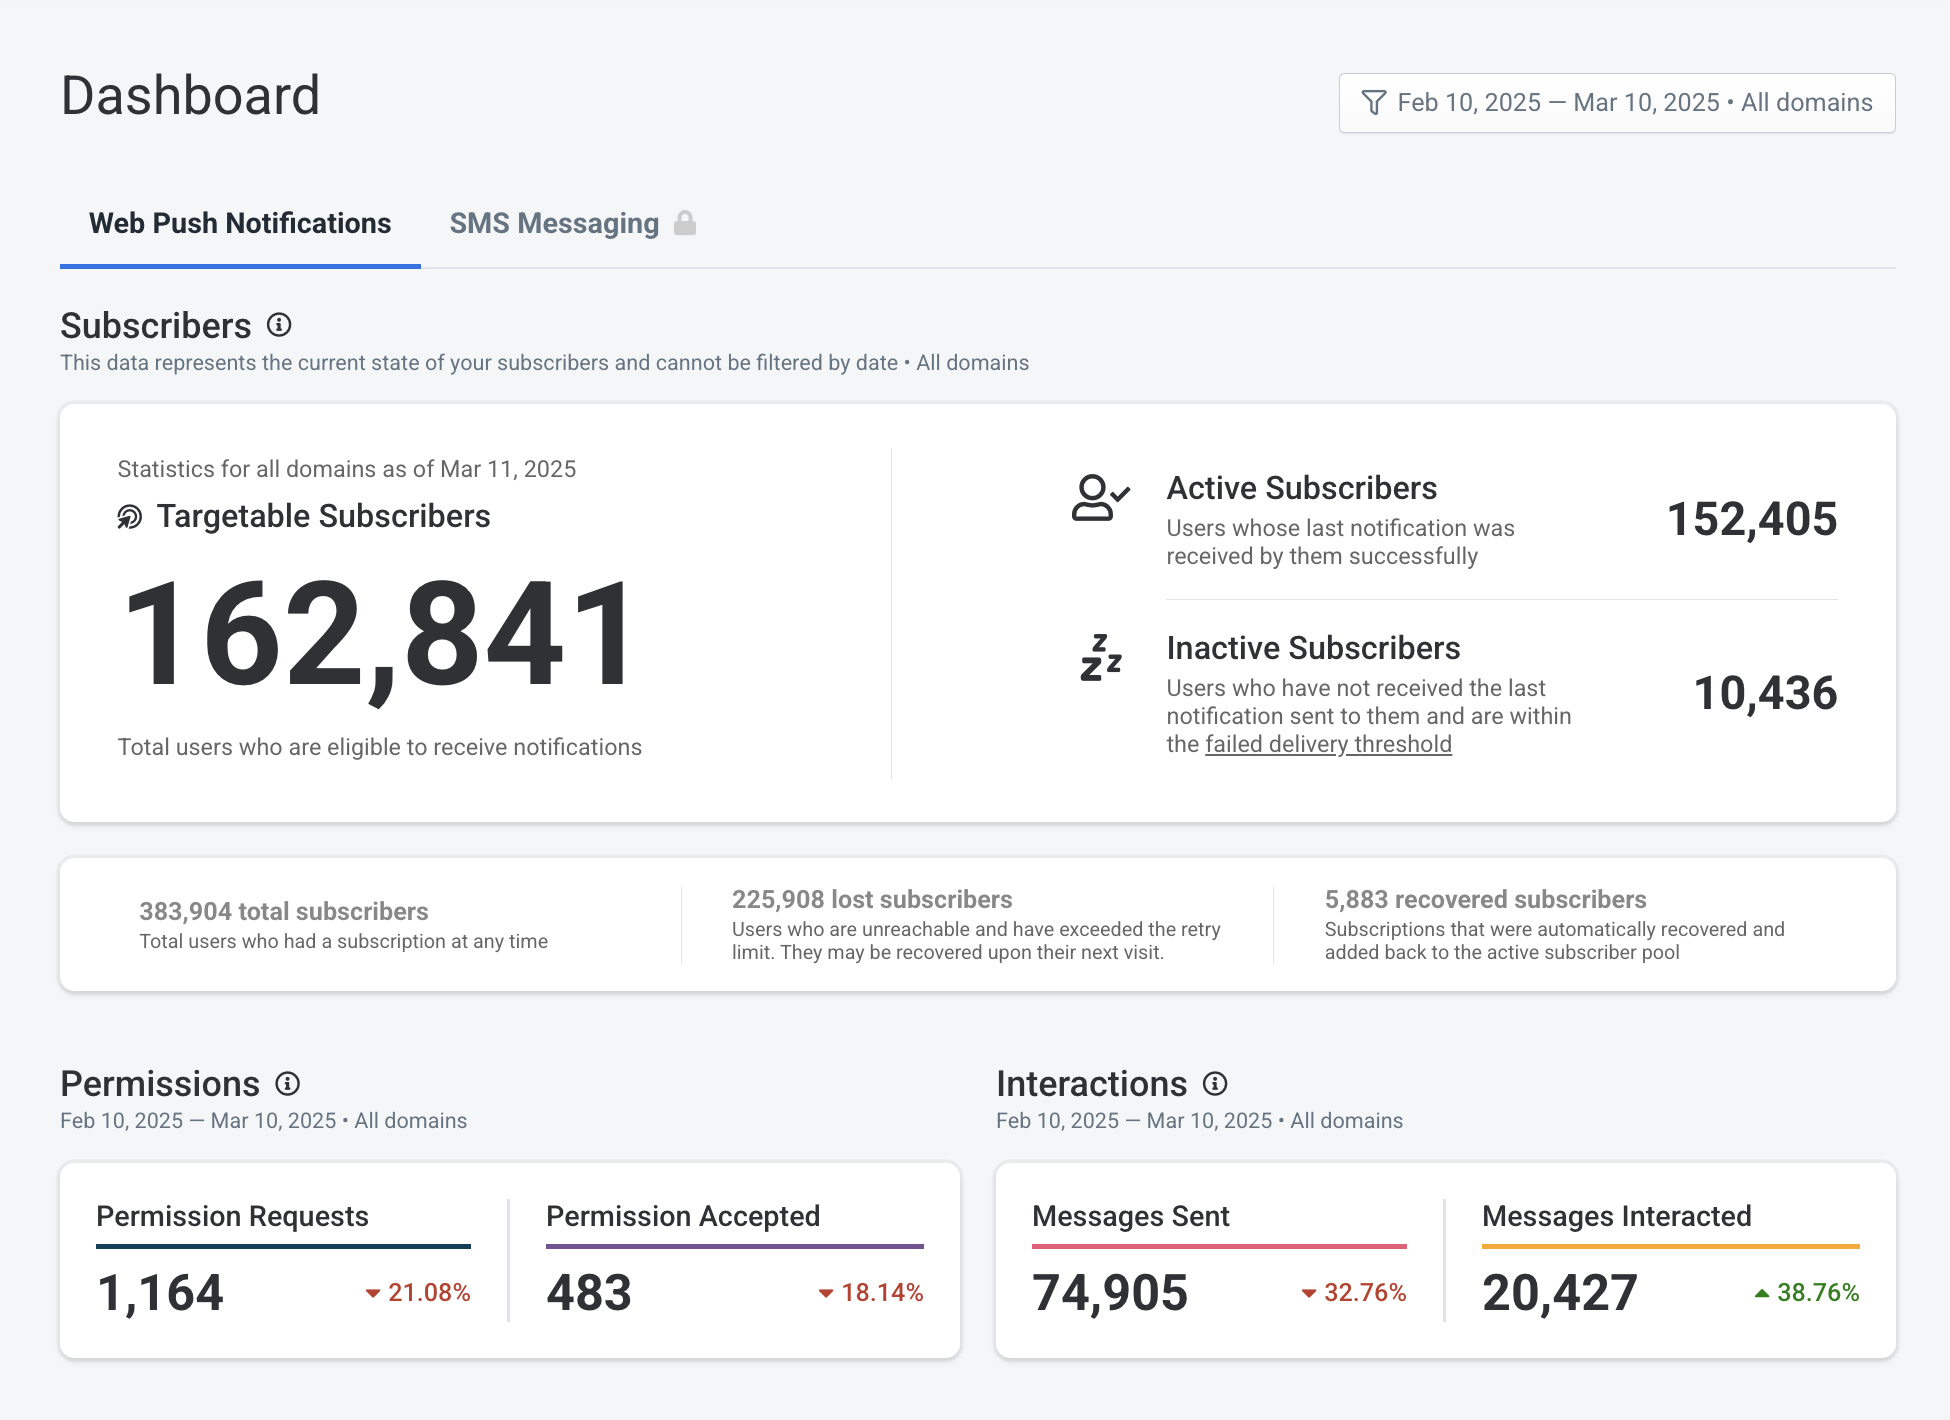
The web push notification dashboard displays general statistics related to the performance of your web push notifications in Fanplayr. This data is filterable on a date range and domain. The dashboard can be accessed via the "Dashboard" link on the left sidebar of the Messaging section of the portal. This is also where the SMS dashboard is located (if enabled). Use the tab selector at the top of the screen to switch between the SMS and web push dashboards.
Subscribers
The top "Subscribers" section of the dashboard shows the current state of your web push subscribers. The most important number here is the "Targetable Subscribers", which serves as the subscriber pool that could possibly receive your next web push notification (depending on the notification's filters).
Information here cannot be filtered on date as it represents the current state, but the data still can be filtered on domain.
Permissions / Accepted
A portion of the dashboard is reserved for data related to web push subscription requests and the rate in which these requests were accepted. The dashboard includes aggregates by date as well as general aggregates over the entire filter date range.
Sent / Interacted
Similar to permissions, the dashboard contains a few sections dedicated to sent notifications and interacted notifications. This information is aggregated by date in the time series graphs and aggregated over the entire period above the charts.
INFO
Note: It is possible that the interaction rate (interacted messages / sent messages) can be over 100% on certain days if users end up interacting with messages that were sent on the previous day. See the notification lists at the bottom of the dashboard for more specific interaction details.
Notification Breakdown
At the bottom of the dashboard, there are two tables with message sent + interaction data split by notification. The first table consists of manual messages that are scheduled and sent at one time. The next contains template notifications that can be sent via Streams (one at a time).
These tables can be filtered using the text field above each table and can be ordered by clicking on the column labels. The information in the tables are also filtered by the dashboard-wide filters.
Property Descriptions
| Property | Description |
|---|---|
| Property | Description |
| Targetable Subscribers | Total users who are eligible to receive web push notifications as of today |
| Active Subscribers | Users who successfully received the last notification sent and are expected to receive future notifications correctly |
| Inactive Subscribers | Users who did not successfully receive the last notification sent but will still be sent the next notification following the retry setting |
| Total Subscribers | Total number users who were subscribed to receive notifications at one point in time |
| Lost Subscribers | Users who have been deemed unreachable based on consecutive failed notifications |
| Recovered Subscribers | Users whose subscriptions had been lost but were automatically recovered by our system upon their next visit |
| Permission Requests | Number of web push permission requests sent to your users (following the dashboard filters) |
| Permission Accepted | Number of web push permissions that were accepted by your users (following the dashboard filters) |
| Acceptance Rate | Calculated as (Accepted / Requests) |
| Messages Sent | Number of web push notifications sent to your subscribers (following the dashboard filters) |
| Messages Interacted | Number of web push notifications that were received and clicked by your subscribers (following the dashboard filters) |
| Interaction Rate | Calculated as (Interacted / Sent) |